Tracing
Distributed trace analysis based on Tempo + Grafana Alloy visualizes the call path and latency of a request across multiple microservices, helping quickly locate cross-service performance bottlenecks and exceptions. Open it from "Tracing → Trace Analysis" in the left sidebar.
Trace Analysis
The top of the page contains three service-aggregated overview charts, and the bottom contains a searchable trace list:
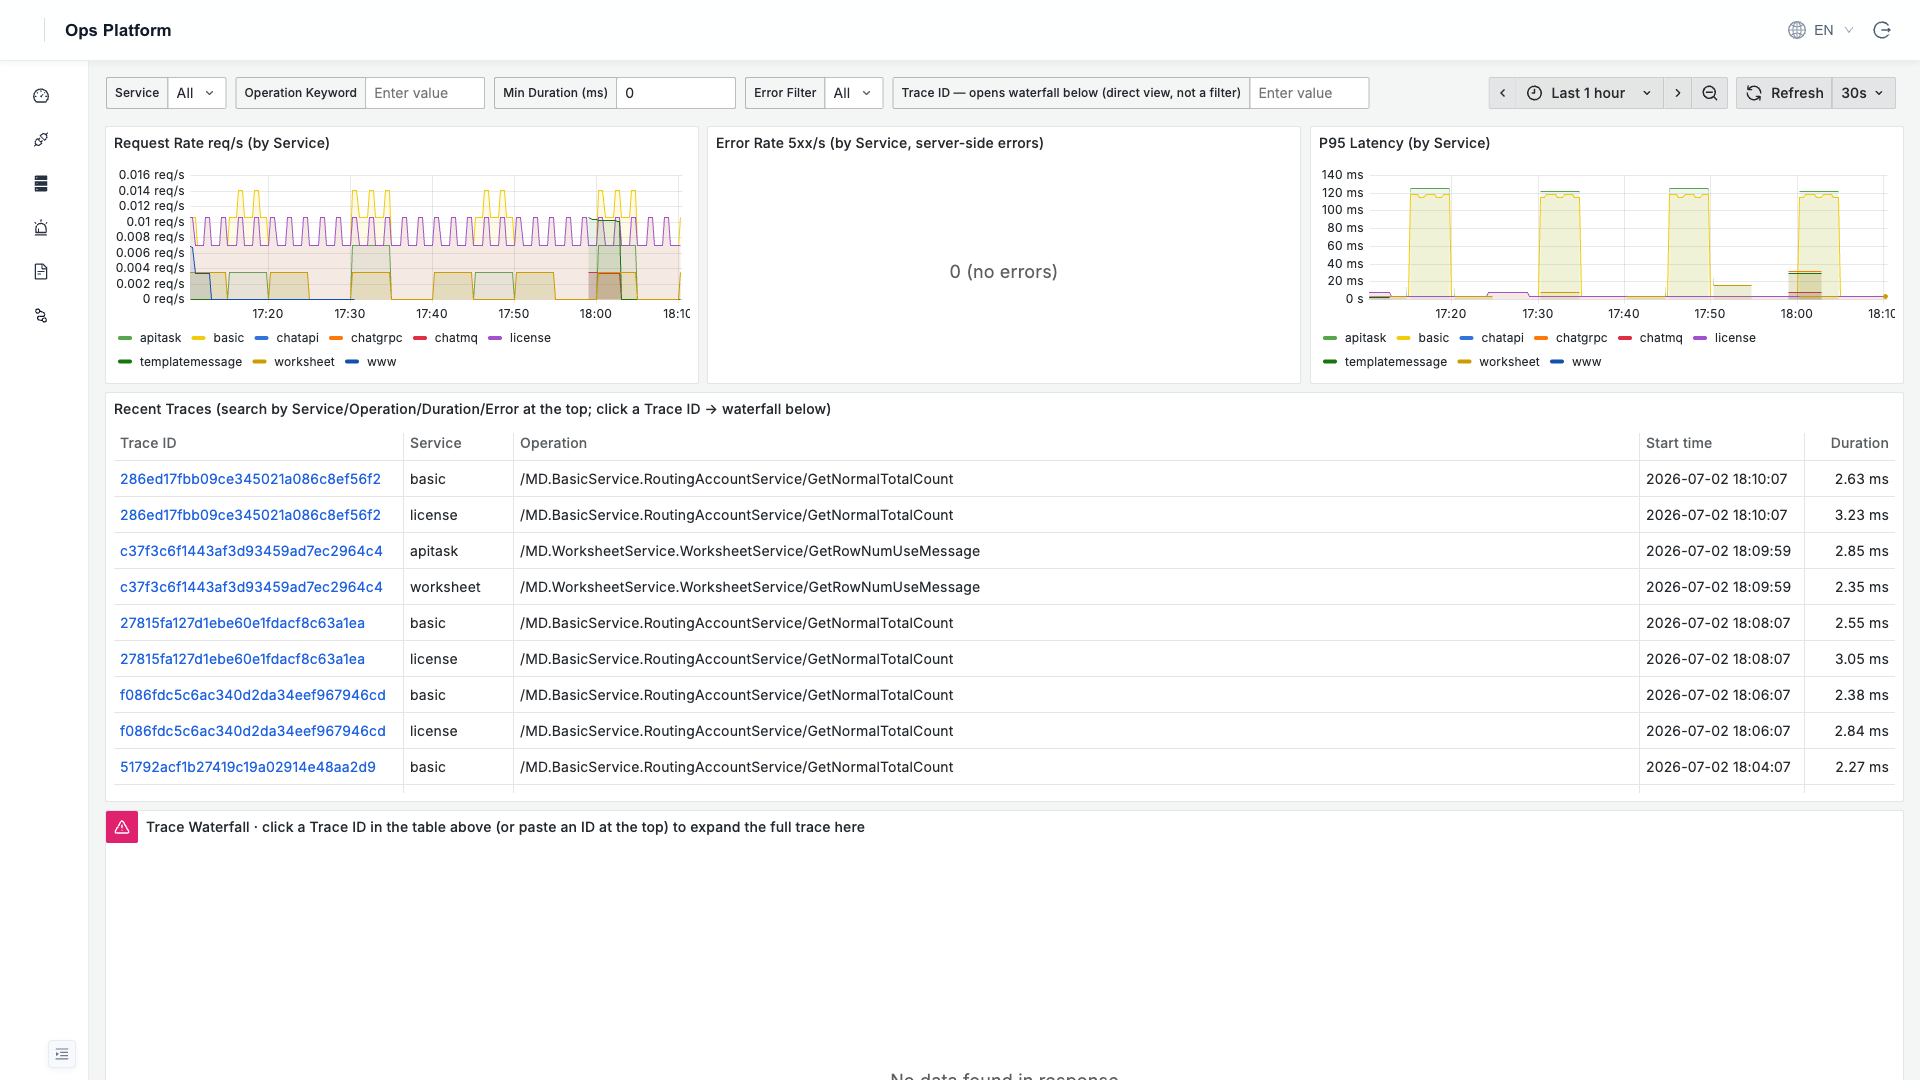
| Area | Description |
|---|---|
| Request Rate | Request rate by service, colored by service |
| Error Rate | Server-side error rate by service, useful for finding abnormal services |
| P95 Latency | 95th percentile latency by service, used to identify slow services |
| Recent Traces | Recent trace details (Trace ID/service/operation/start time/duration) |
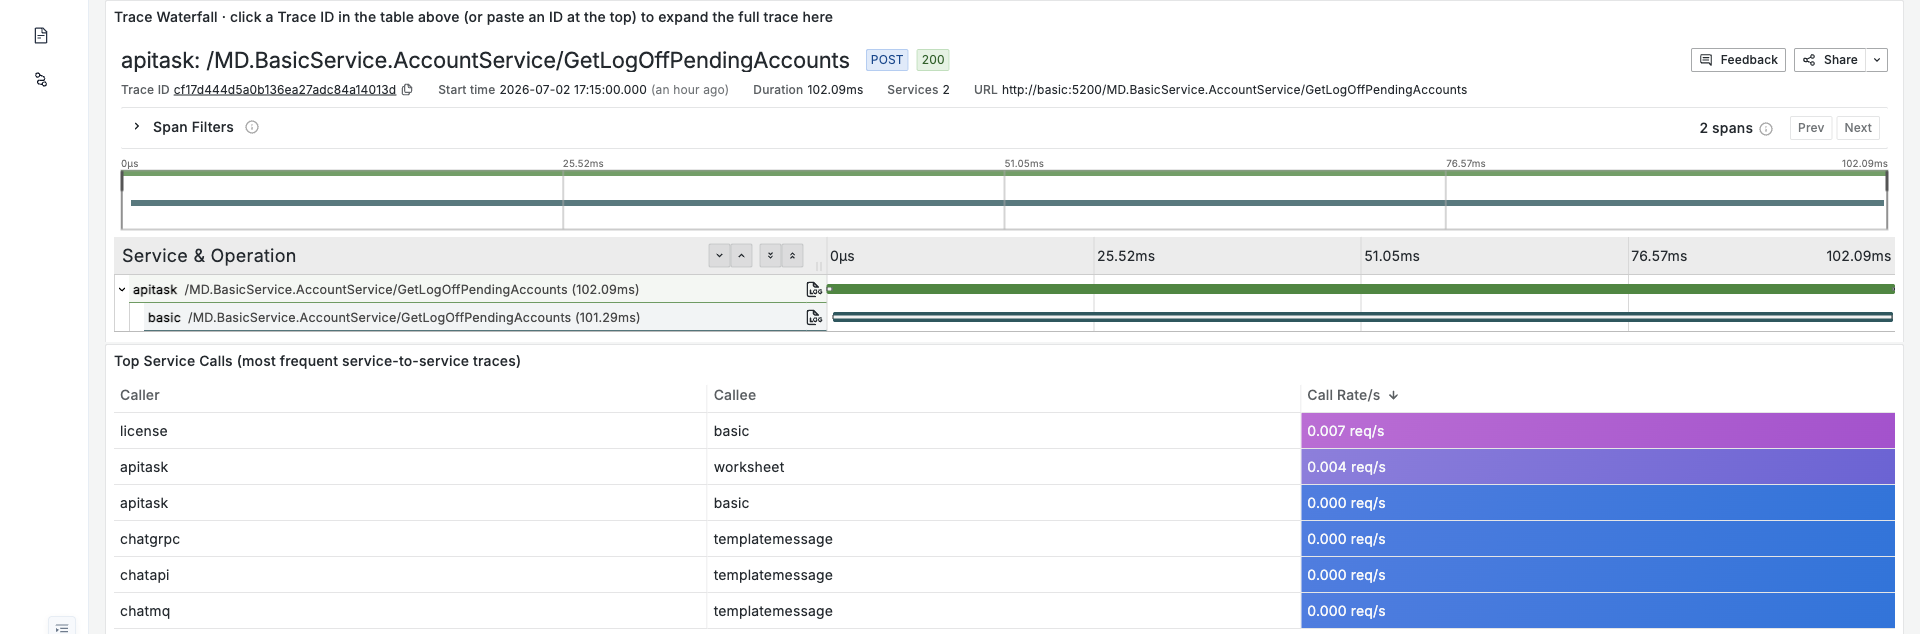
| Top Service Calls | Most frequent service-to-service calls and call rates, showing service dependencies intuitively |
Search and Drill Down
The top of the list supports multi-dimensional filters:
- Service: Filter by service.
- Operation Keyword: Filter by operation name keyword.
- Min Duration (ms): Show only traces whose duration exceeds the threshold to locate slow requests.
- Error Filter: Show only traces with errors.
- Trace ID: Paste a Trace ID directly to expand the waterfall below (span-level duration) for precise troubleshooting.
Click any Trace ID in the list to expand the complete request waterfall below and analyze the duration of each span across services:
Not Connected Yet?
Trace data is reported by the business side through OTLP. See Tracing Ingestion for the connection steps.
Tracing is intended for Kubernetes cluster deployment. Standalone (Docker Compose) deployment is not supported, so this page has no data in standalone scenarios.
Trace retention is controlled by ENV_TEMPO_RETENTION (30 days by default). See Environment Variables.