Alert Rules
Configure monitoring rules under "Alert Management → Alert Rules". Select built-in metrics or use custom PromQL expressions.
Set thresholds and notification policies according to your environment. Improper configuration may cause false positives or missed alerts. Validation in a test environment before production use is recommended.
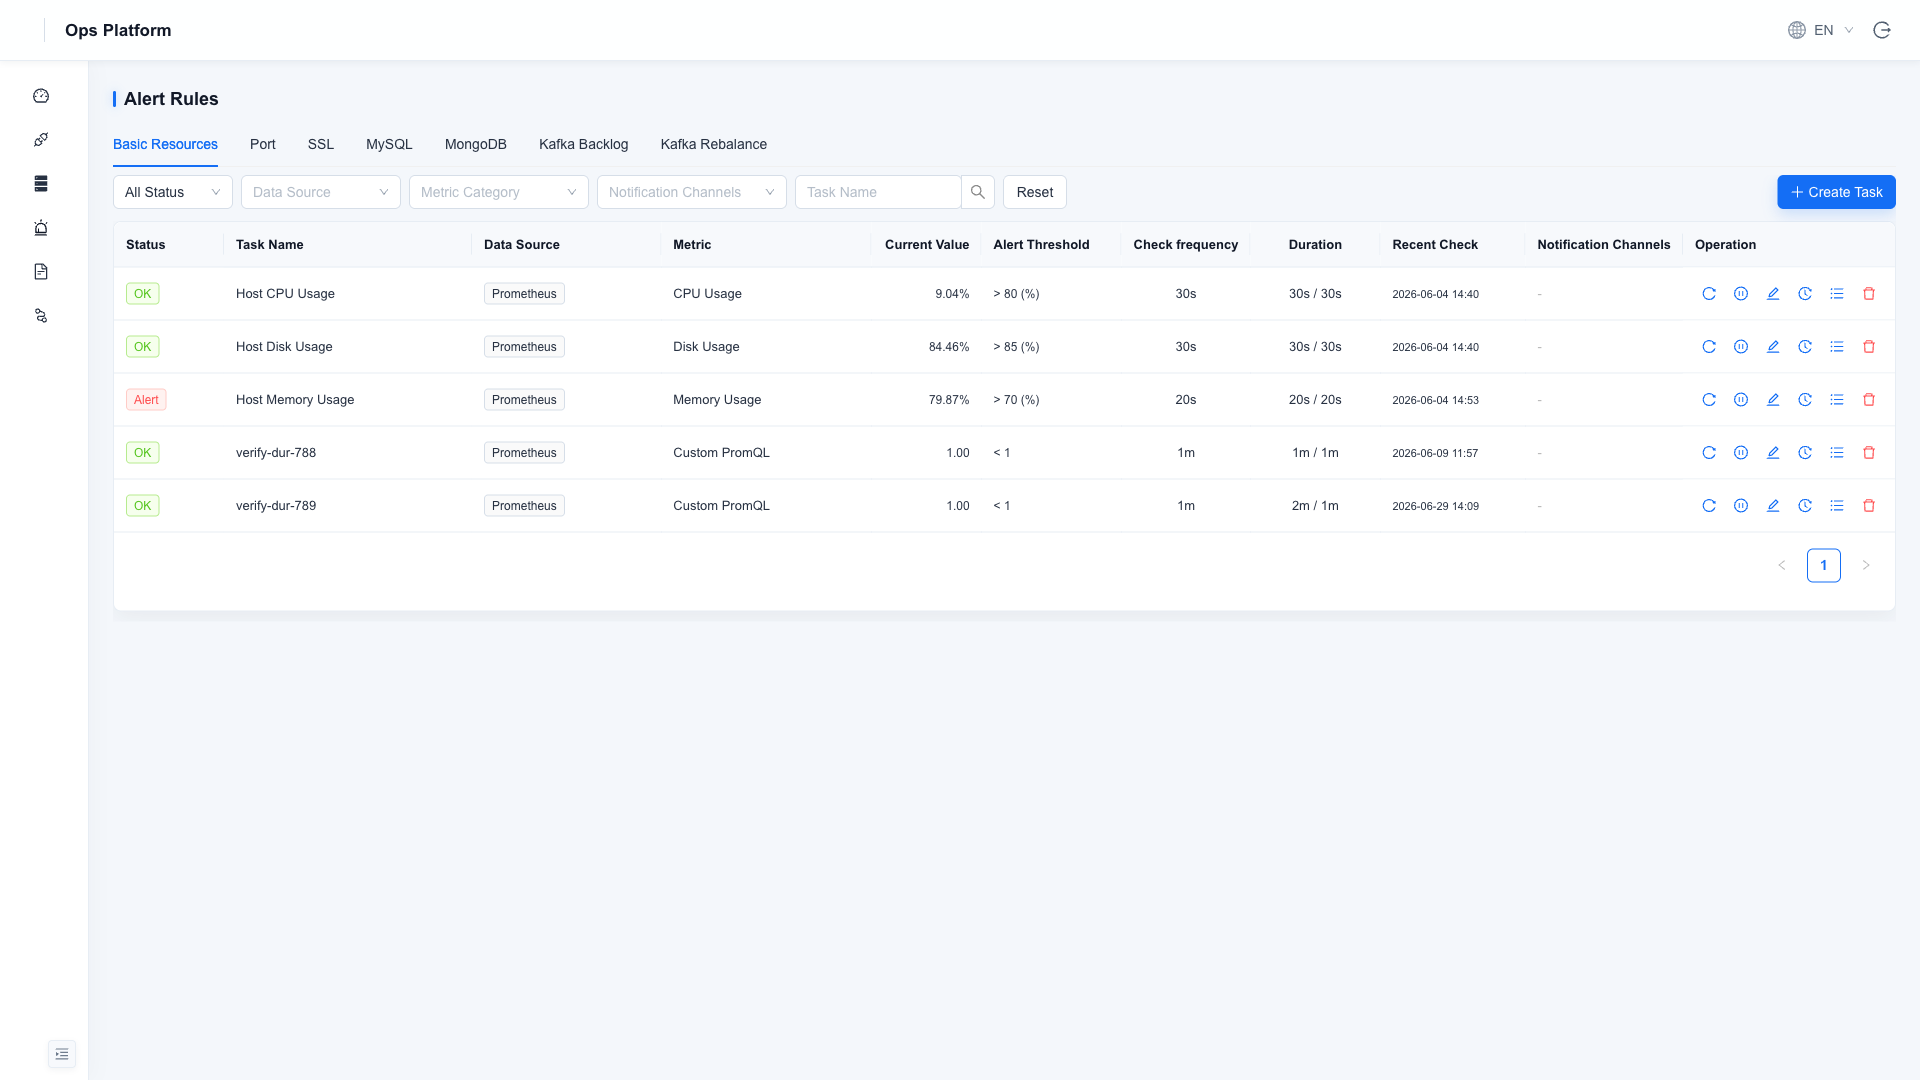
Monitoring Types
Rules are grouped by monitoring type. Middleware types appear only after the corresponding Data Source is enabled:
| Tab | Monitoring Scope | Condition |
|---|---|---|
| Basic Resources | CPU, memory, disk, and other host/middleware metrics; custom PromQL is supported | Always |
| Port | TCP port connectivity probing | Always |
| SSL | HTTPS certificate validity period | Always |
| MySQL | Specialized checks such as connections and slow queries | MySQL data source enabled |
| MongoDB | Specialized checks such as connections and replication lag | MongoDB data source enabled |
| Kafka Lag | Consumer group lag backlog | Kafka data source enabled |
| Kafka Rebalance | Frequent consumer group rebalance | Kafka data source enabled |
Create a Rule
Click "New Task" and fill in the fields:
| Field | Description |
|---|---|
| Task Name | Unique and readable, such as High production host CPU |
| Data Source | Target instance to monitor |
| Metric | Select a built-in metric, or choose "Custom PromQL" to enter an expression and preview the results |
| Alert Threshold | Operator + threshold, such as > 80 |
| Check Frequency | How often the rule is checked |
| Duration | How long the metric must continuously exceed the threshold before entering the alert state, filtering out short spikes |
| Notification Channel | Bind a notification channel; if not bound, records are kept only inside the Ops Platform |
State Flow
Rules send notifications when their state changes. A continuously firing alert does not send repeated notifications:
Normal ──threshold exceeded──▶ Pending ──duration satisfied──▶ Firing ──recovered──▶ Recovered
| State | Meaning |
|---|---|
| Pending | Threshold exceeded, but duration not yet satisfied |
| Firing | Threshold exceeded and duration satisfied; notification has been sent |
| Recovered | Recovered from alert state; recovery notification sent |
| Paused | Rule manually paused and no longer scheduled |
Common Operations
- Check Now: Skip the wait and run one check immediately.
- Pause/Enable: Temporarily stop scheduling during planned maintenance, replacing the old "alert silence" flow.
- Instance Details: View current values for matched instances. Per-instance silence is supported, so individual instances can be suppressed while the rule continues to run.
- Alert History: View trigger records for this rule. See Alert History for records from all rules.