Resource Monitoring
Provides visualization dashboards for hosts, middleware, Kubernetes clusters, and other targets. The left submenu is generated dynamically from enabled types in Data Sources. Enabling a data source type displays the corresponding dashboard.
Submenus
| Submenu | Data Source |
|---|---|
| Host | node_exporter |
| MySQL | mysqld_exporter |
| MongoDB | mongodb_exporter |
| Redis | redis_exporter |
| Kafka | kafka_exporter |
| Elasticsearch | elasticsearch_exporter |
| Kubernetes | kube-state-metrics/kubelet. See Kubernetes Cluster Monitoring |
| Custom pages | Any external Web UI (such as Flink), registered in Data Sources |
Host Monitoring
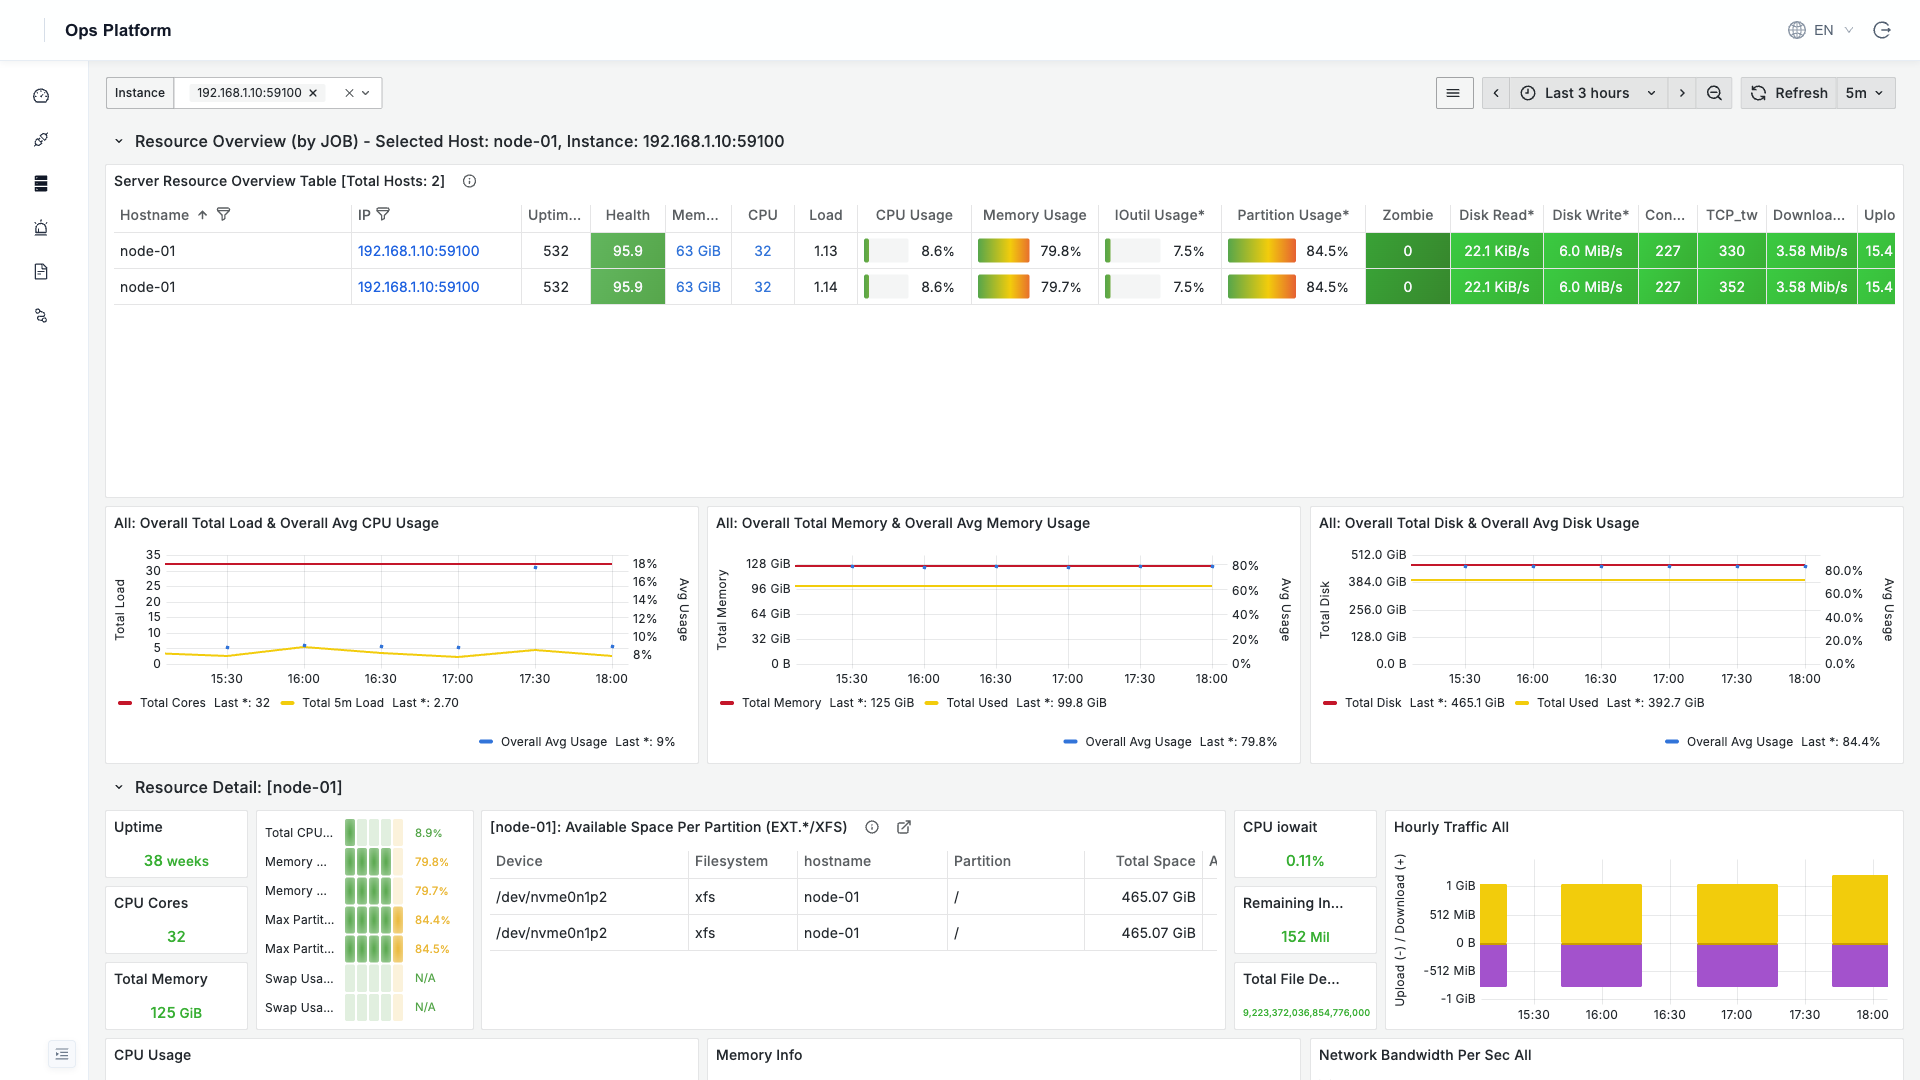
The "Host" page summarizes resource status for all hosts. The top section is a resource detail table for all hosts (CPU/memory/load/disk/partition usage, zombie processes, health score, and more). The lower section expands time-series details for CPU, memory, disk, and network by host. Click a host IP to drill down into the full host dashboard.
Middleware Monitoring
Each middleware type has a dedicated dashboard. Use the "Instance" dropdown at the top to switch among multiple instances of the same type.
MongoDB
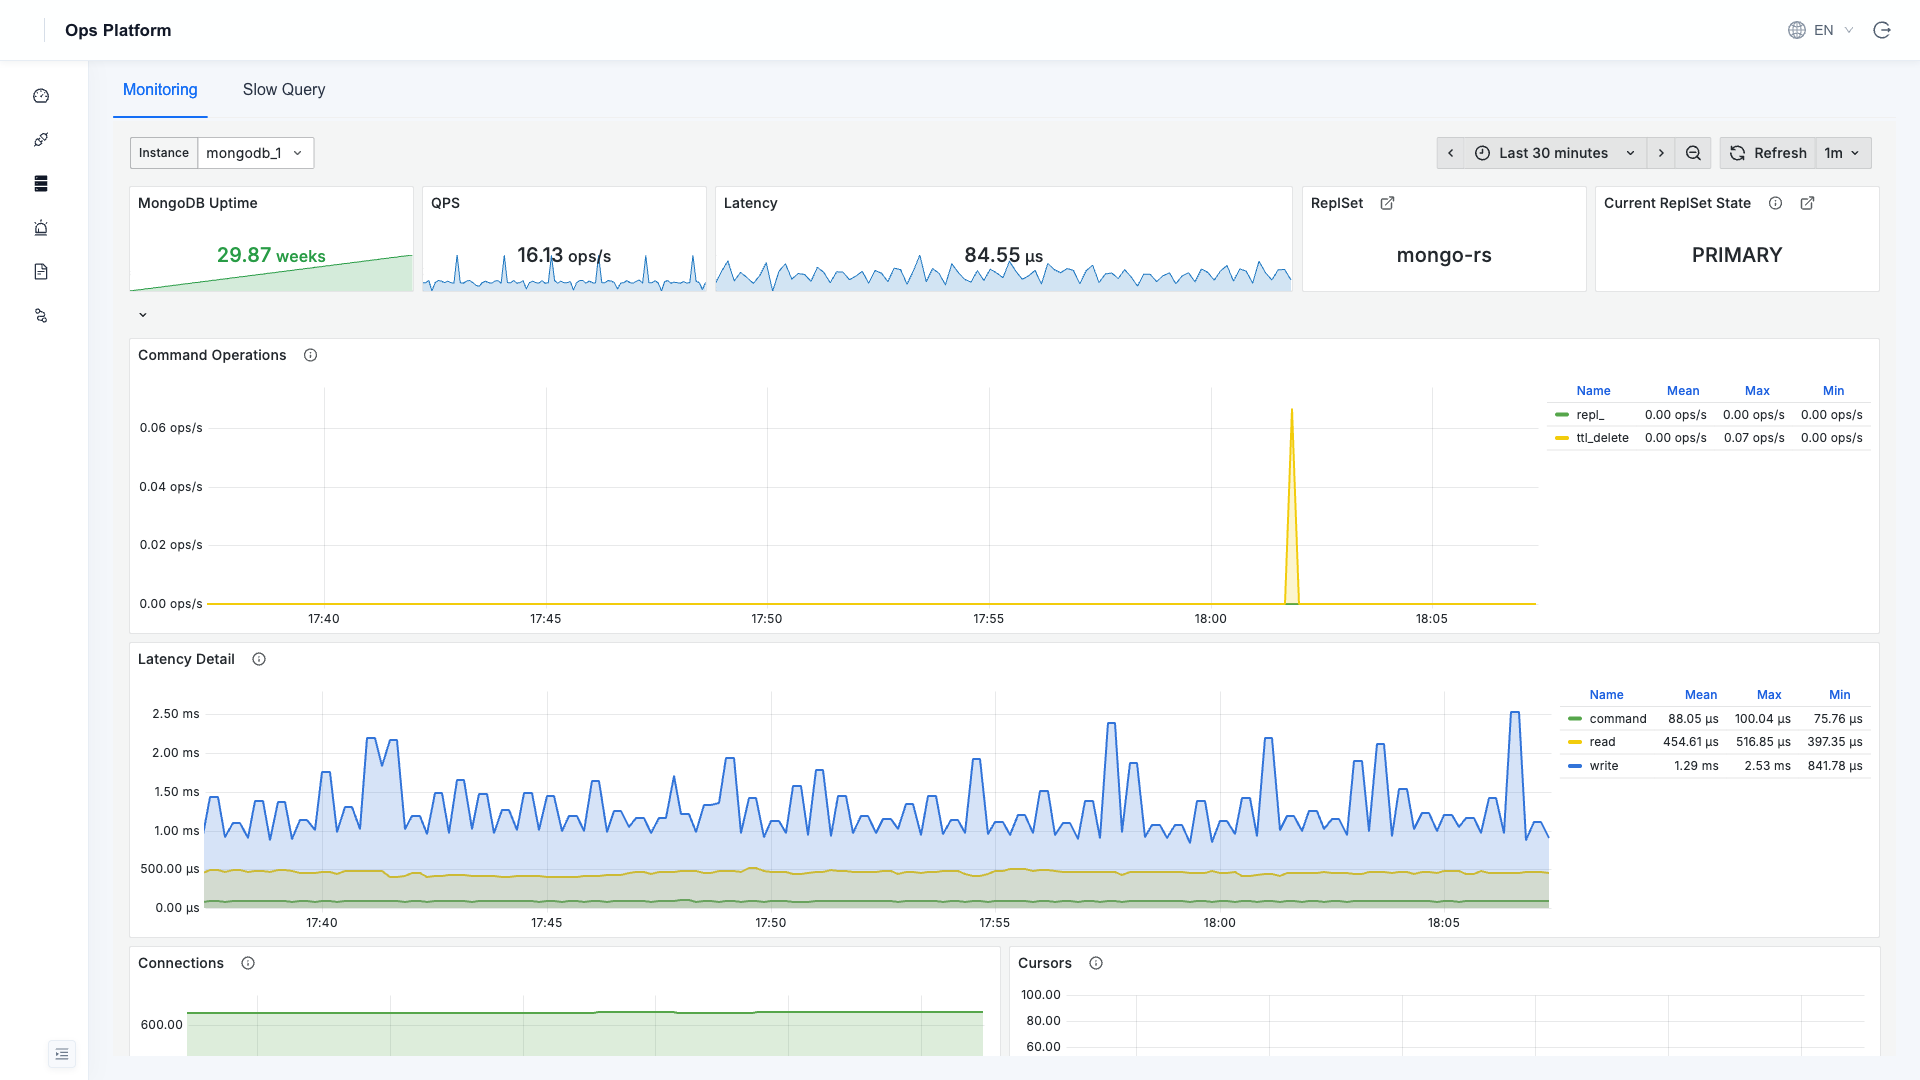
Runtime duration, QPS, latency, replica set role, command operations, connections, query efficiency, and more. The top contains "Monitoring" and "Slow Query" tabs. The slow query tab links to MongoDB Slow Query Analysis.
MySQL
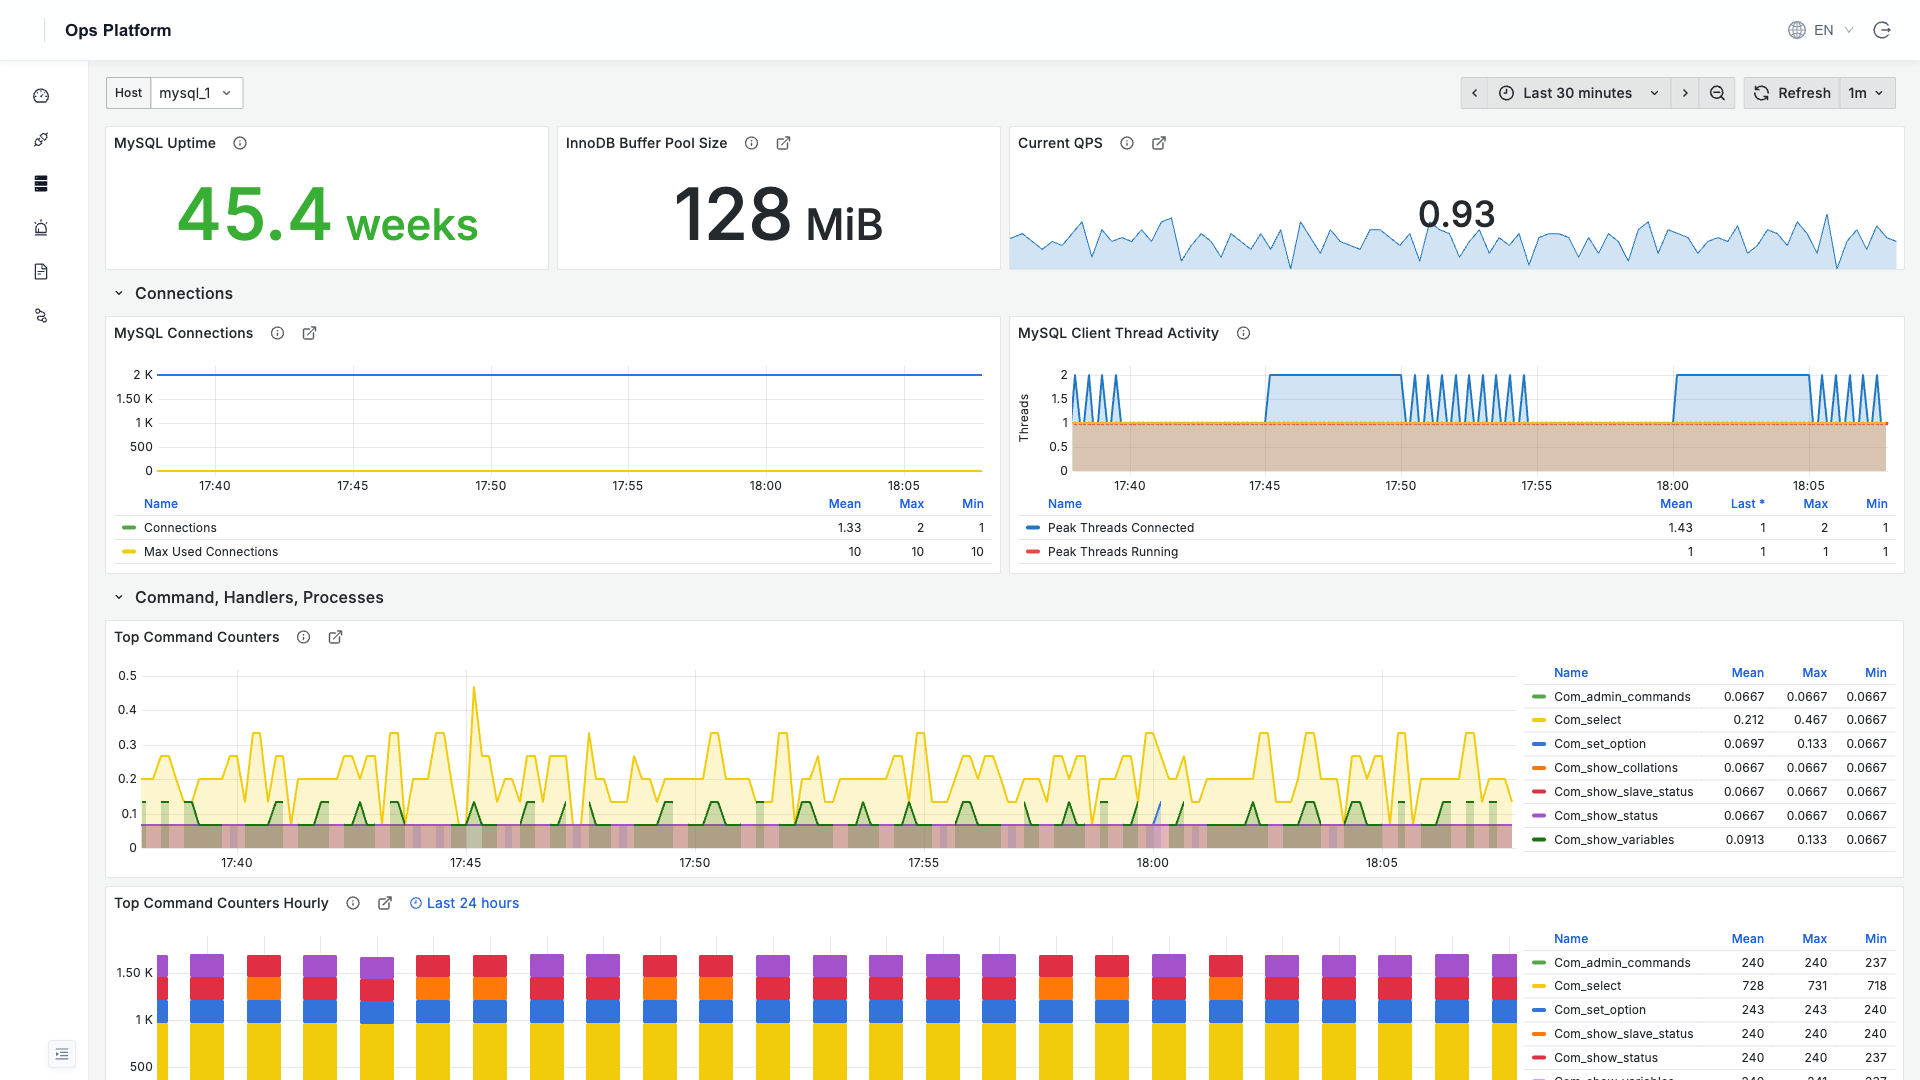
Uptime, QPS, connections, InnoDB buffer pool, client thread activity, command statistics, and more.
Redis
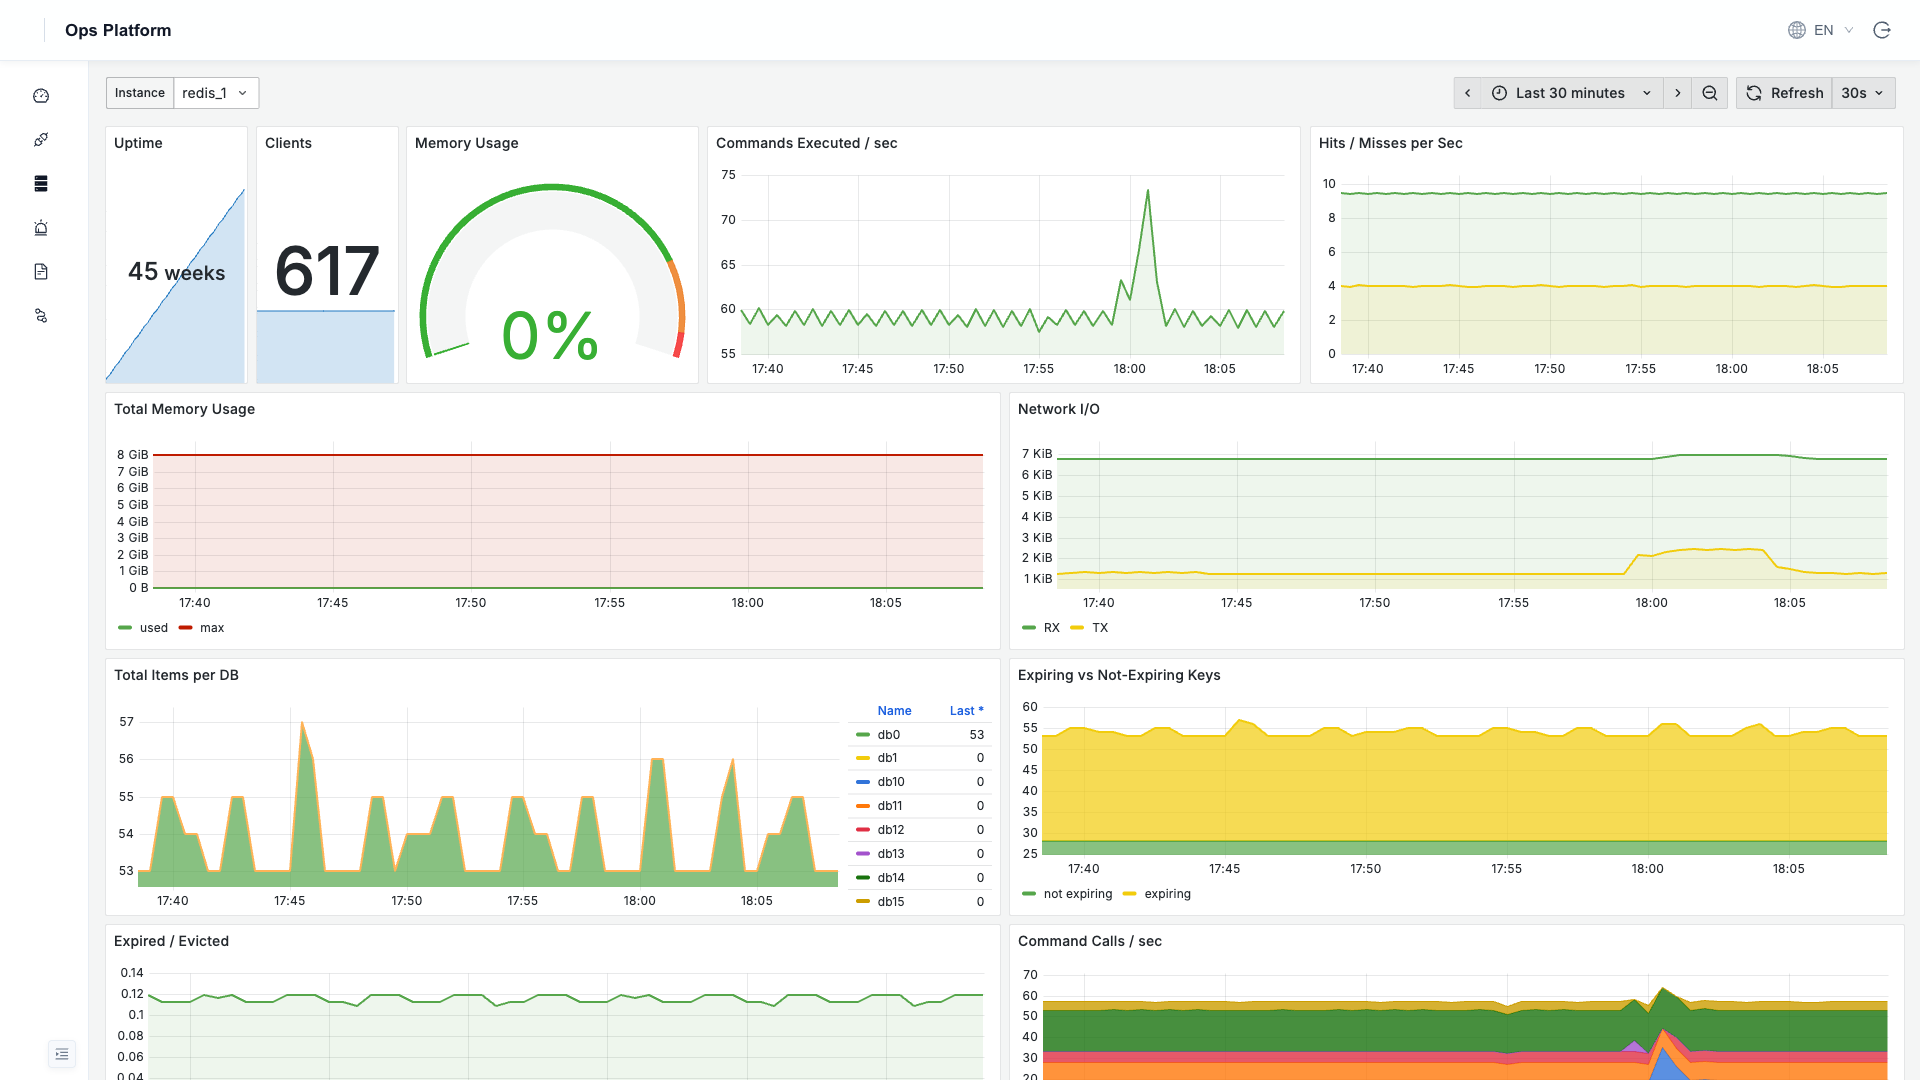
Uptime, connections, memory usage, command execution/hit rate, network I/O, key counts by DB, and more.
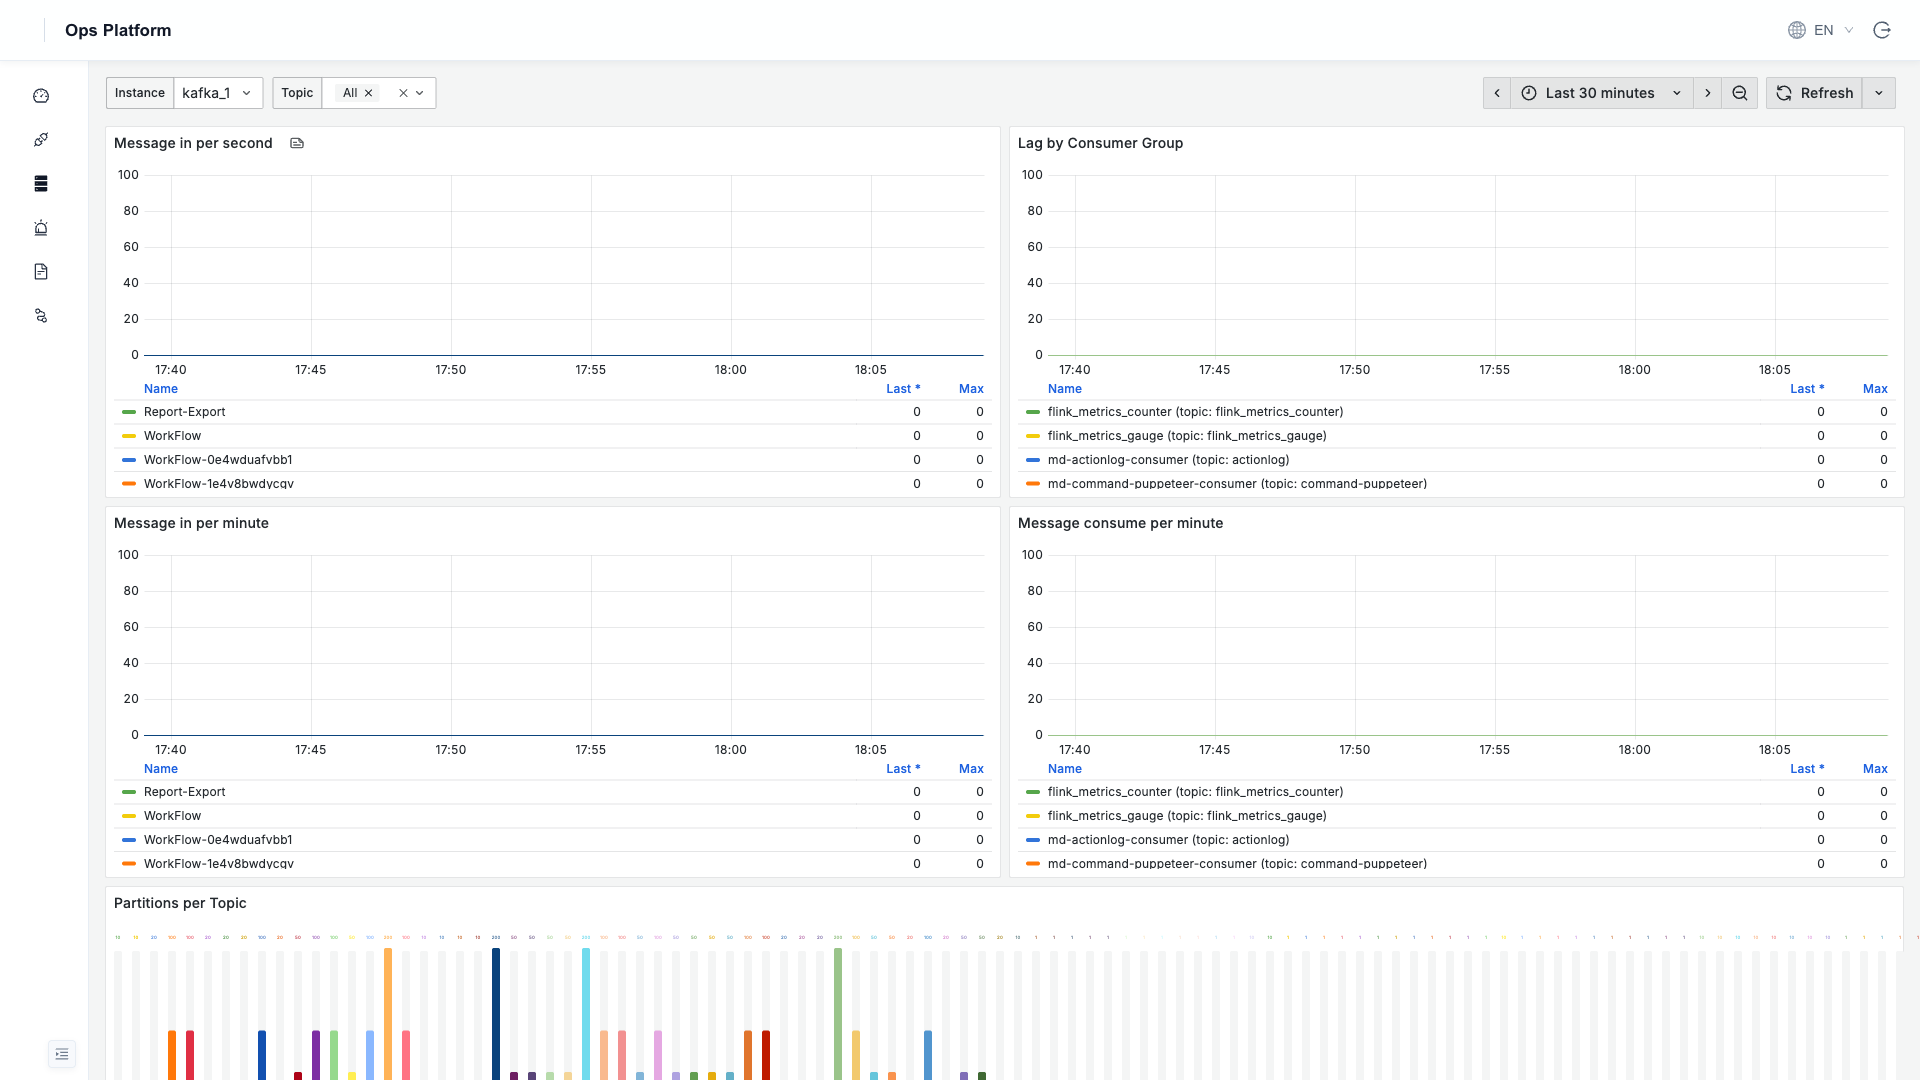
Kafka
Message production/consumption rate, consumer group lag, topic partition distribution, and more.
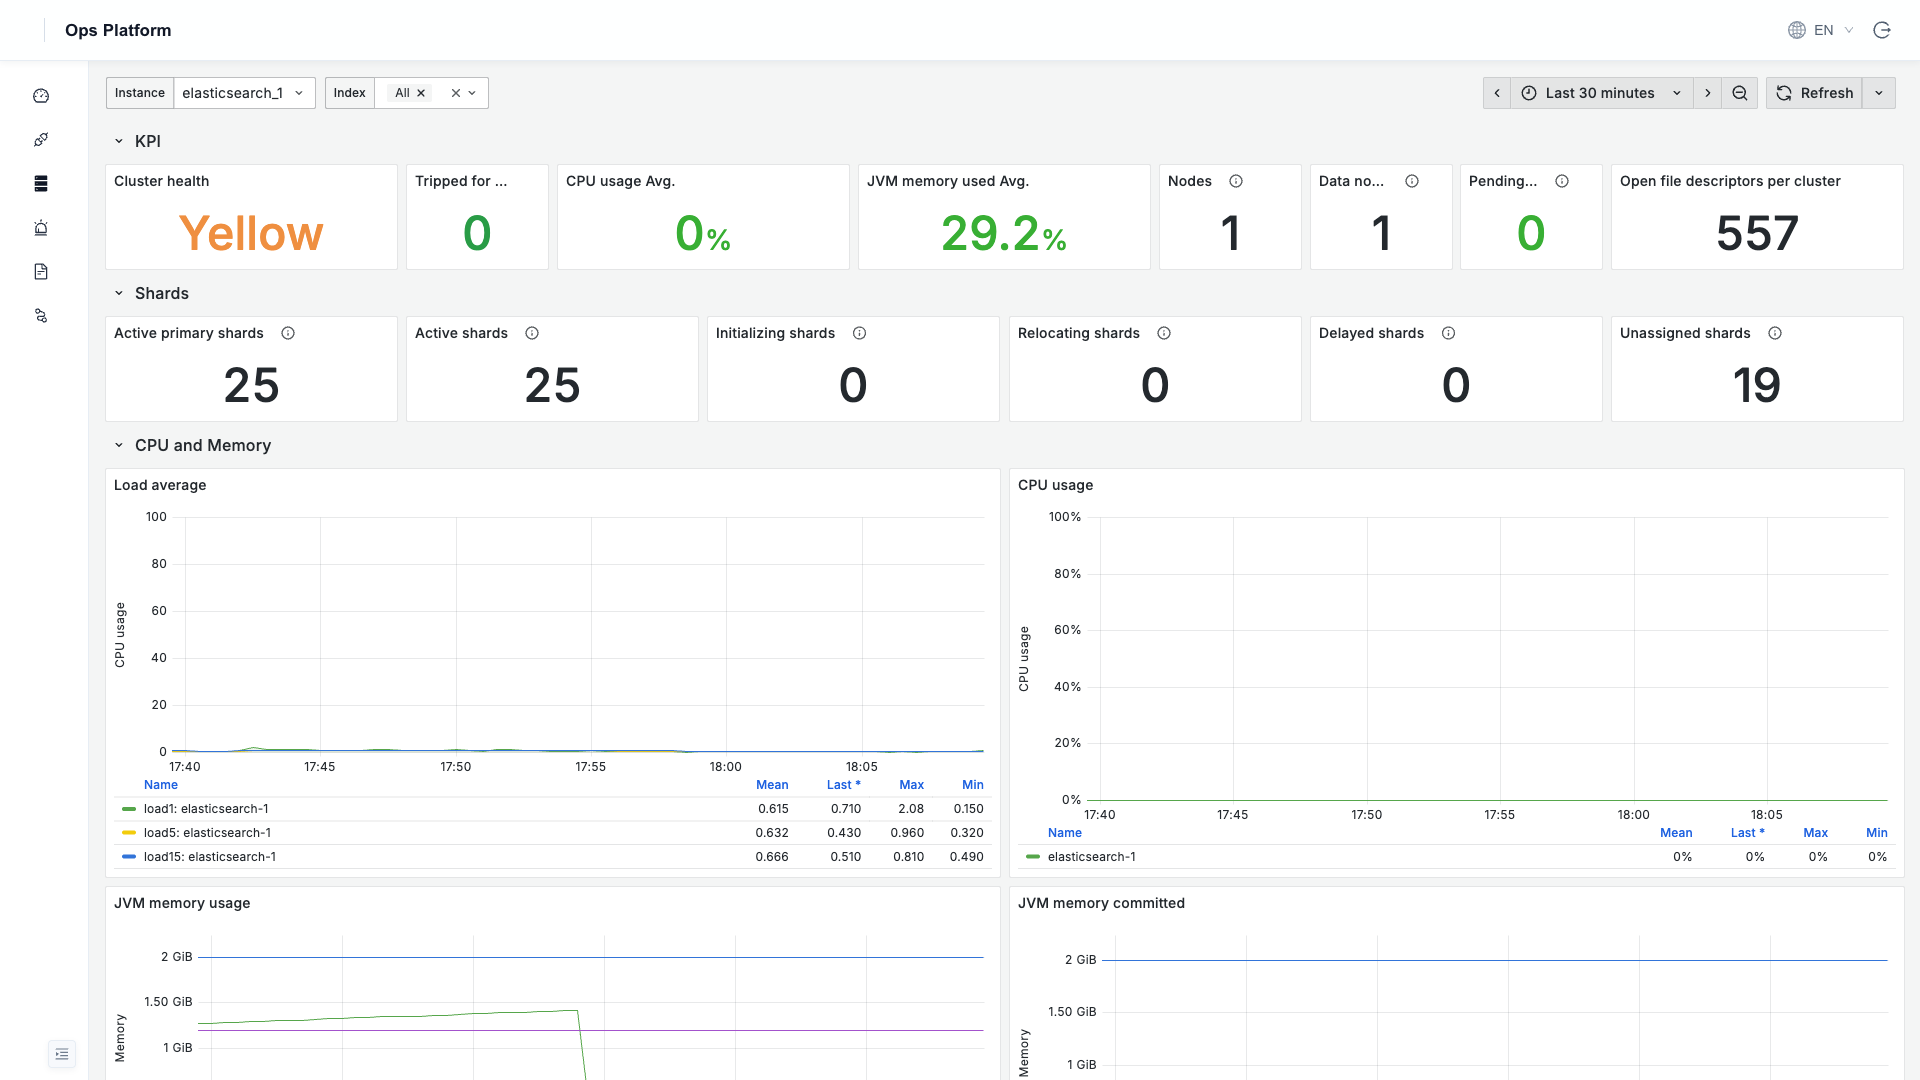
Elasticsearch
Cluster health, shard status, node CPU/JVM heap memory, disk and network, document indexing rate, and more.
Dashboard Operations
Resource monitoring dashboards are embedded from Grafana. Common operations:
- Instance selector: Switch among multiple instances of the same type from the
Instancedropdown in the upper-left corner. - Time range: Switch the time window in the upper-right corner (default: last 3 hours/30 minutes). Custom ranges and auto-refresh are supported.
- Expand/collapse: Click group row titles in the dashboard to expand or collapse them.
Dashboard content is in English. Grafana custom panel text does not change with the platform language, so English is used consistently across languages. Panel titles, legends, and metric labels do not affect the data itself.
Kubernetes and Custom Pages
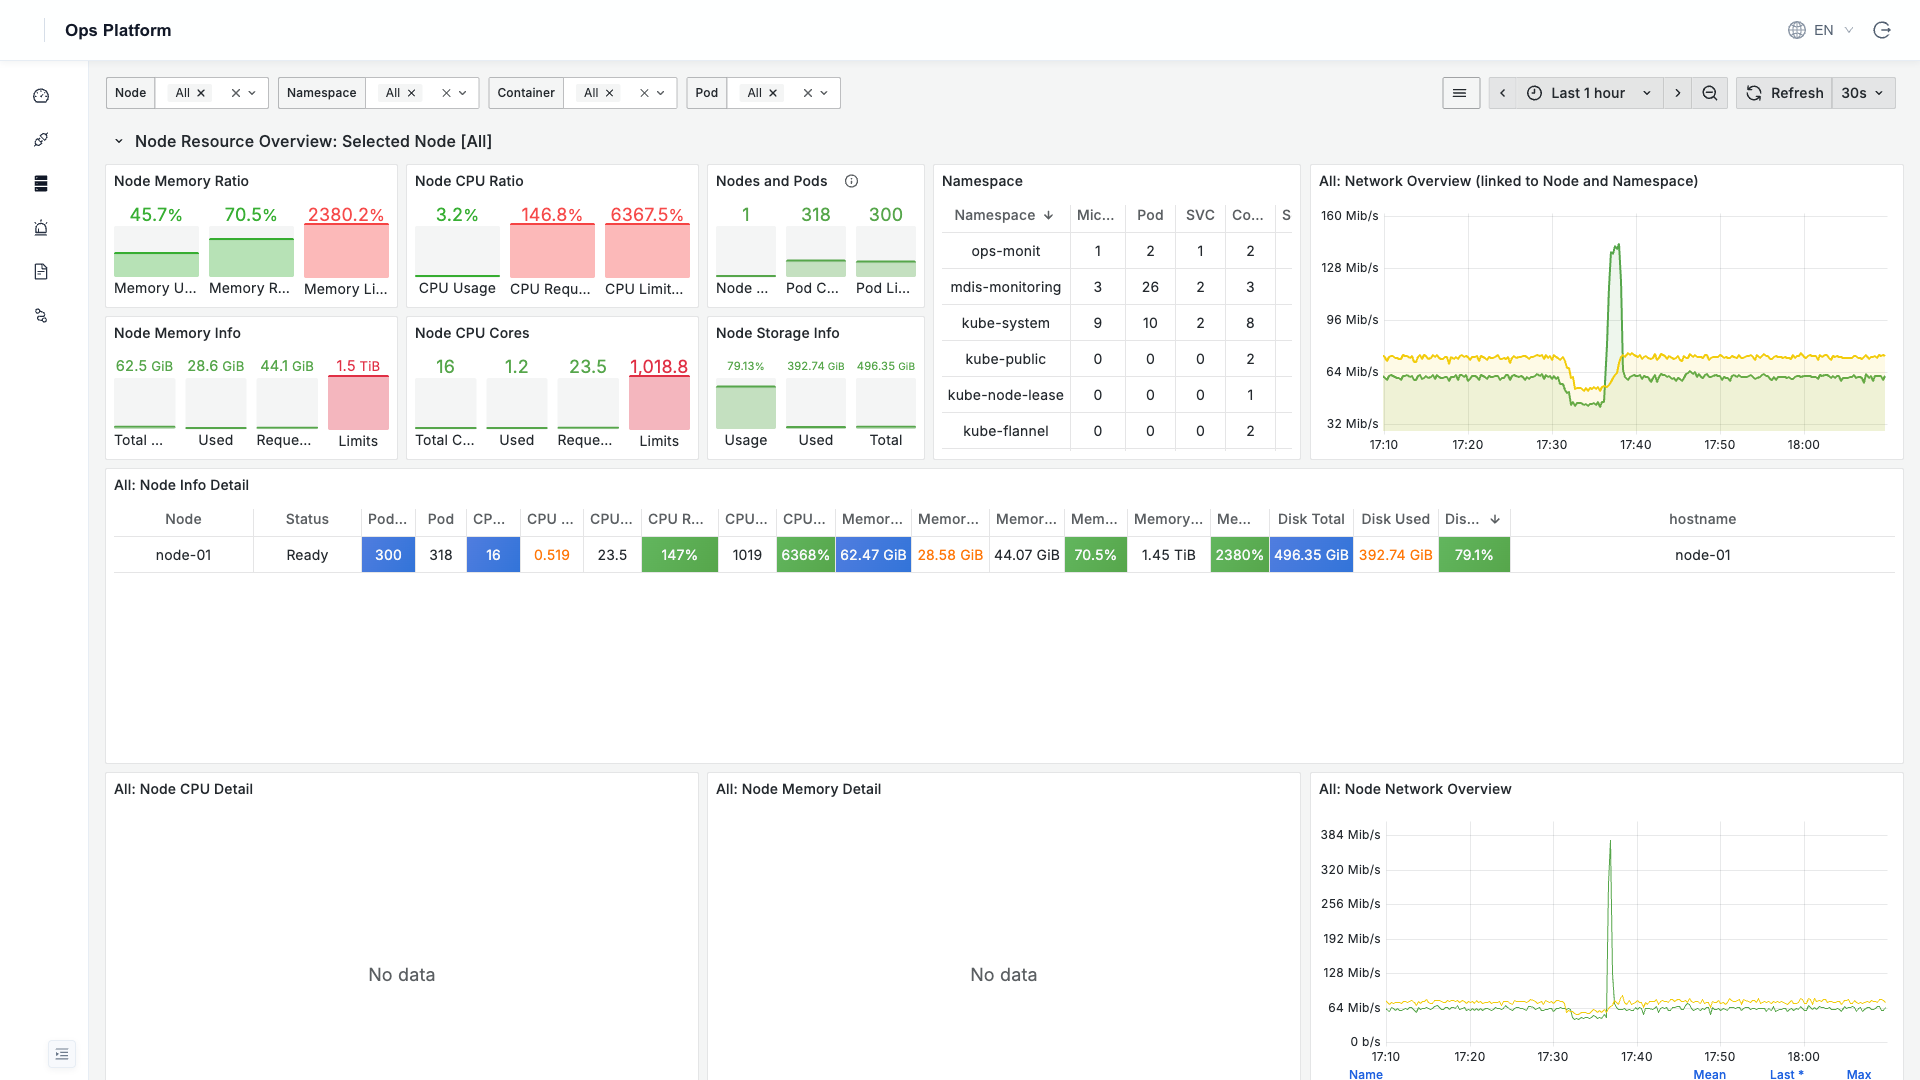
Kubernetes: Monitors cluster nodes, containers, Pods, and cluster object status (node resources, namespaces, CPU/memory quotas, Pod distribution, and more). Configure collection according to Kubernetes Cluster Monitoring.
Custom pages: External Web UIs registered on the "Data Sources" page (such as Flink or Langfuse) appear in the "Custom" sidebar group. In reverse proxy mode the platform forwards the traffic and no extra port exposure is needed; in direct iframe mode the browser connects to the target directly. See Data Sources for configuration.