Overview
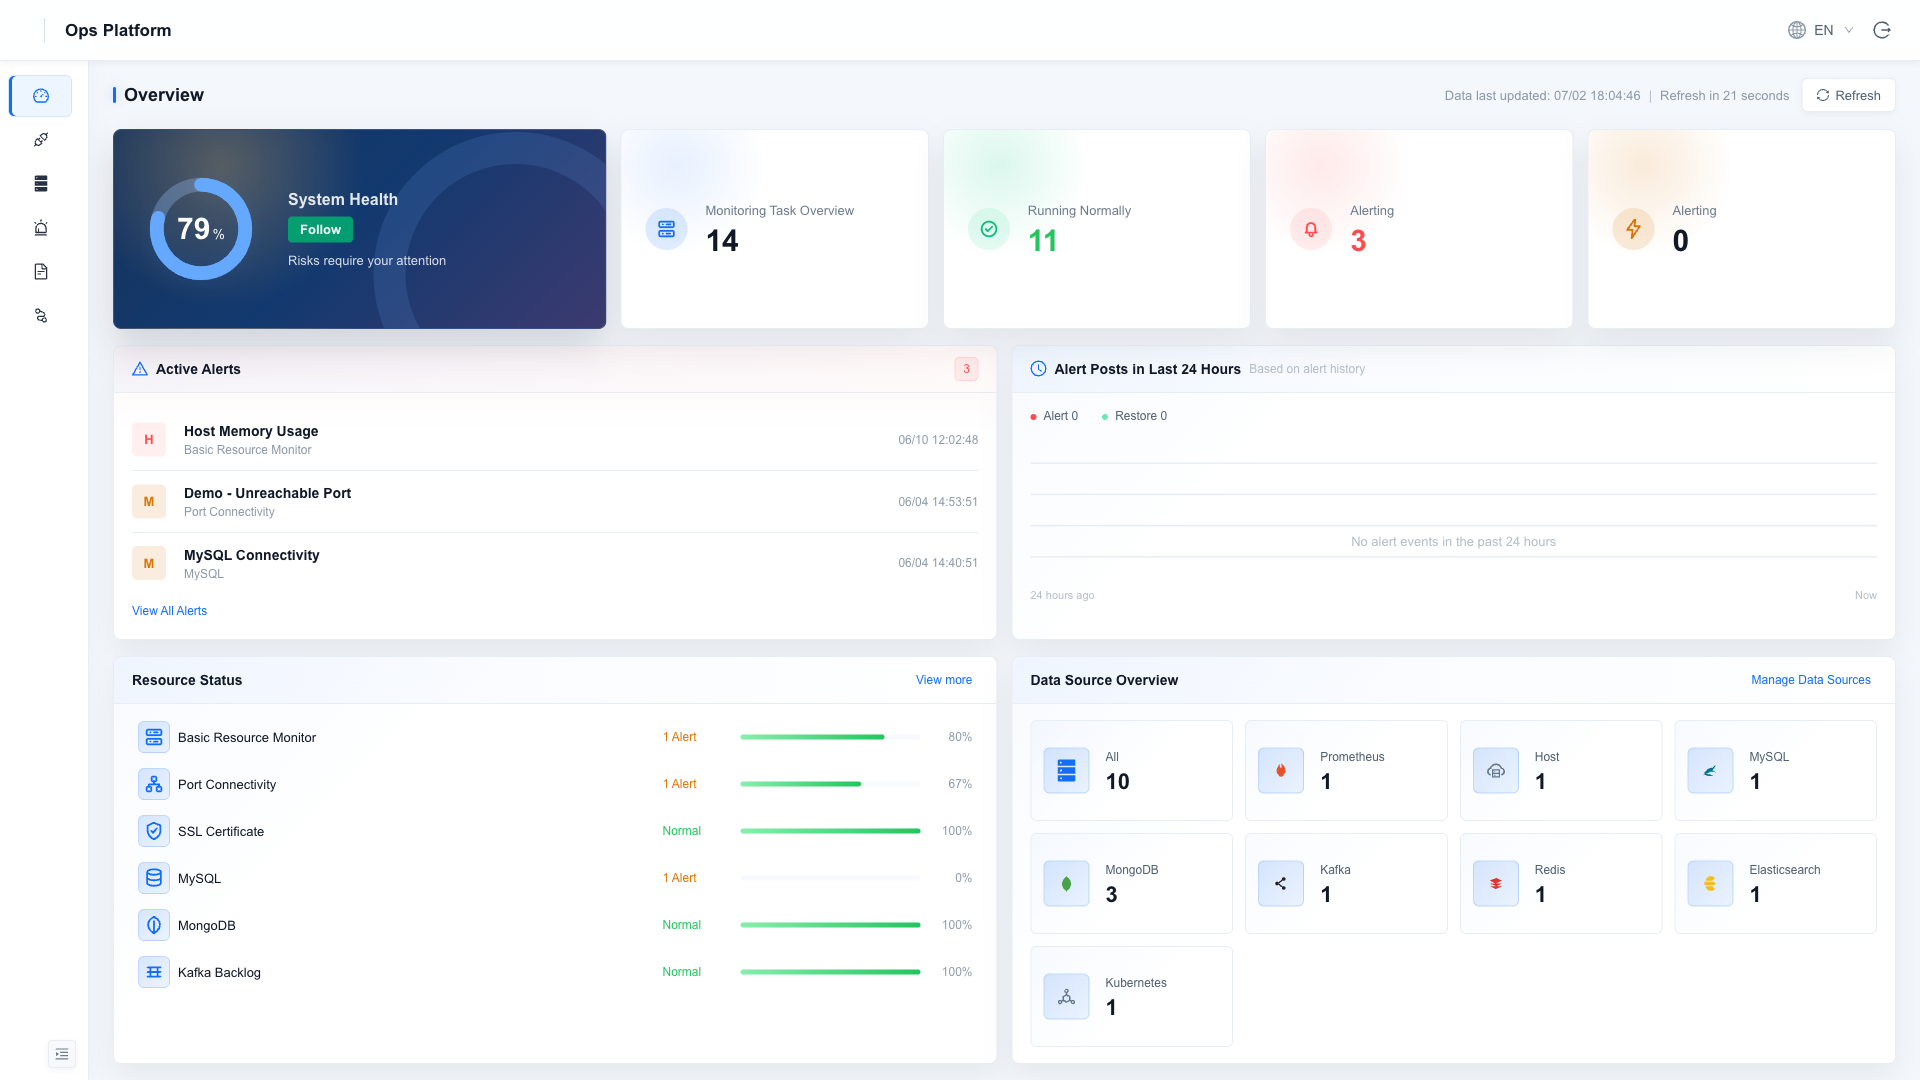
The Ops Platform monitors and diagnoses HAP/HDP private deployment environments. It brings together host, middleware, and Kubernetes cluster monitoring information, with log search, tracing, slow query analysis, and alerts to help operations teams check status and troubleshoot problems.
After deployment, add hosts and middleware in Data Sources, then connect service logs and tracing as needed for your environment.
Feature Overview
| Module | Capability | Documentation |
|---|---|---|
| Overview | System health, monitoring task statistics, active alerts, and alert activity over the last 24 hours | This page |
| Resource Monitoring | View monitoring information for hosts, middleware, and Kubernetes clusters; embed external pages such as Flink as custom pages | Resource Monitoring |
| Alerts | Configure monitoring rules and notification channels; view alert status, recovery, and history | Alert Rules |
| Logs | Search container logs and HAP/HDP microservice logs by time and keyword | Log Search |
| Tracing | View request paths and duration across microservices in Kubernetes environments | Tracing |
| Slow Query Diagnostics | Analyze MongoDB slow queries, inspect query details, and review index recommendations | MongoDB Slow Query Analysis |
When deployed inside the monitored Kubernetes cluster, the platform can collect that cluster's metrics automatically. To monitor other clusters, deploy collection components in each target cluster. See Kubernetes Cluster Monitoring.
Technical Architecture
The Ops Platform uses Prometheus, Grafana, Loki, Tempo, and Grafana Alloy to collect, store, and display monitoring data:
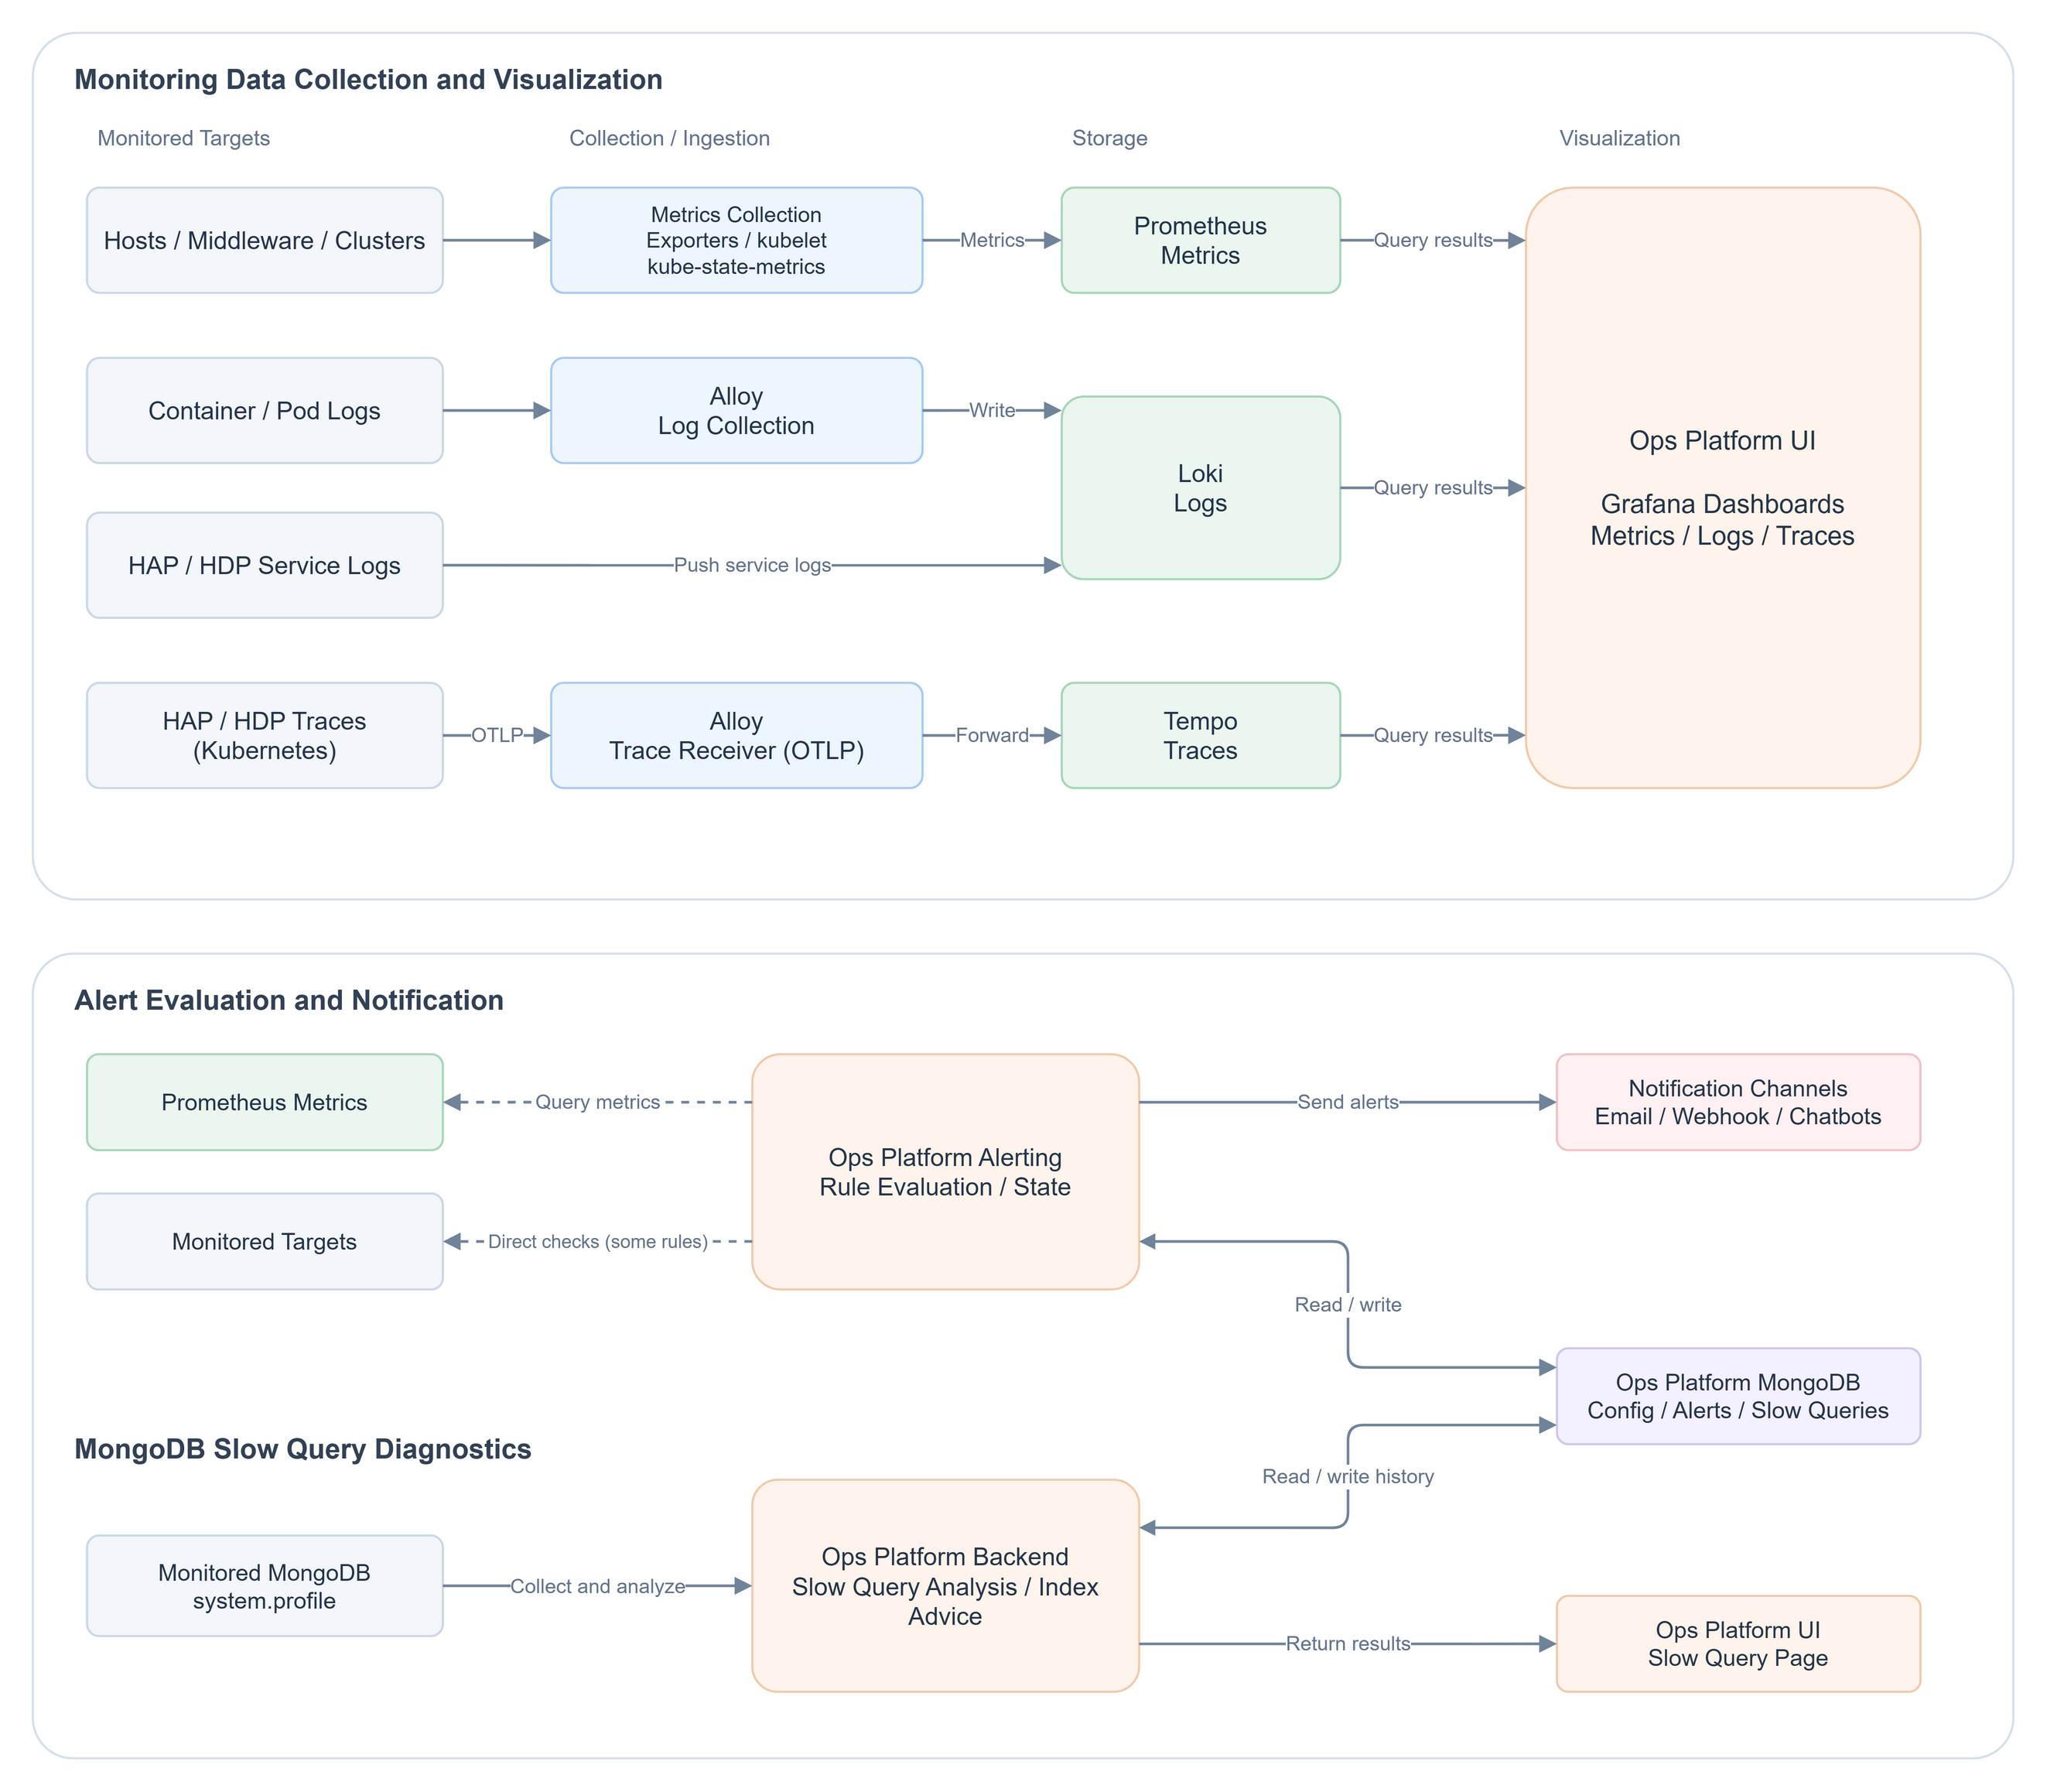
- Metrics: Prometheus collects and stores host, middleware, and Kubernetes cluster metrics. Grafana provides monitoring dashboards.
- Logs: Alloy collects container logs, while HAP/HDP microservices push service logs to Loki. Configure service log ingestion on the product services. See Service Logs.
- Traces: Applications report traces to Alloy through OTLP. Alloy forwards them to Tempo for storage, and Grafana displays them.
- Alerts: The platform queries metrics or checks monitored targets according to rules and sends alerts through notification channels.
- Slow queries: The platform collects MongoDB slow query records, analyzes them, and provides index recommendations.
Alert rules, status, history, and slow query history are stored in the platform's own MongoDB, separately from the monitored business databases.
Component Versions
The platform uses the following components and versions:
| Component | Version | Purpose |
|---|---|---|
| Prometheus | 3.1.0 | Metrics collection and storage |
| Grafana | 12.2.1 | Unified visualization UI |
| Loki | 3.5.8 | Log aggregation and search |
| Tempo | 2.9.0 | Distributed trace storage |
| Grafana Alloy | 1.11.3 | Unified observability collection (container logs/OTLP) |
| Node Exporter | 1.8.2 | Host resource metrics |
| kube-state-metrics | 2.10.1 | Kubernetes cluster object status |
| Kafka Exporter | 1.6.0 | Kafka metrics collection |
| Elasticsearch Exporter | 1.5.0 | Elasticsearch metrics collection |
| Redis Exporter | 1.44.0 | Redis metrics collection |
| MySQL Server Exporter | 0.15.1 | MySQL metrics collection |
| MongoDB Exporter | 0.42.0 | MongoDB metrics collection |
| MongoDB | 4.4.28 | Alert subsystem storage, independent of monitored targets |