Data Source Management
"Data Sources" is the configuration center of the Ops Platform. All monitored hosts, middleware, and clusters are registered here. The available resource monitoring menus and alert rule types are dynamically determined by enabled data sources.
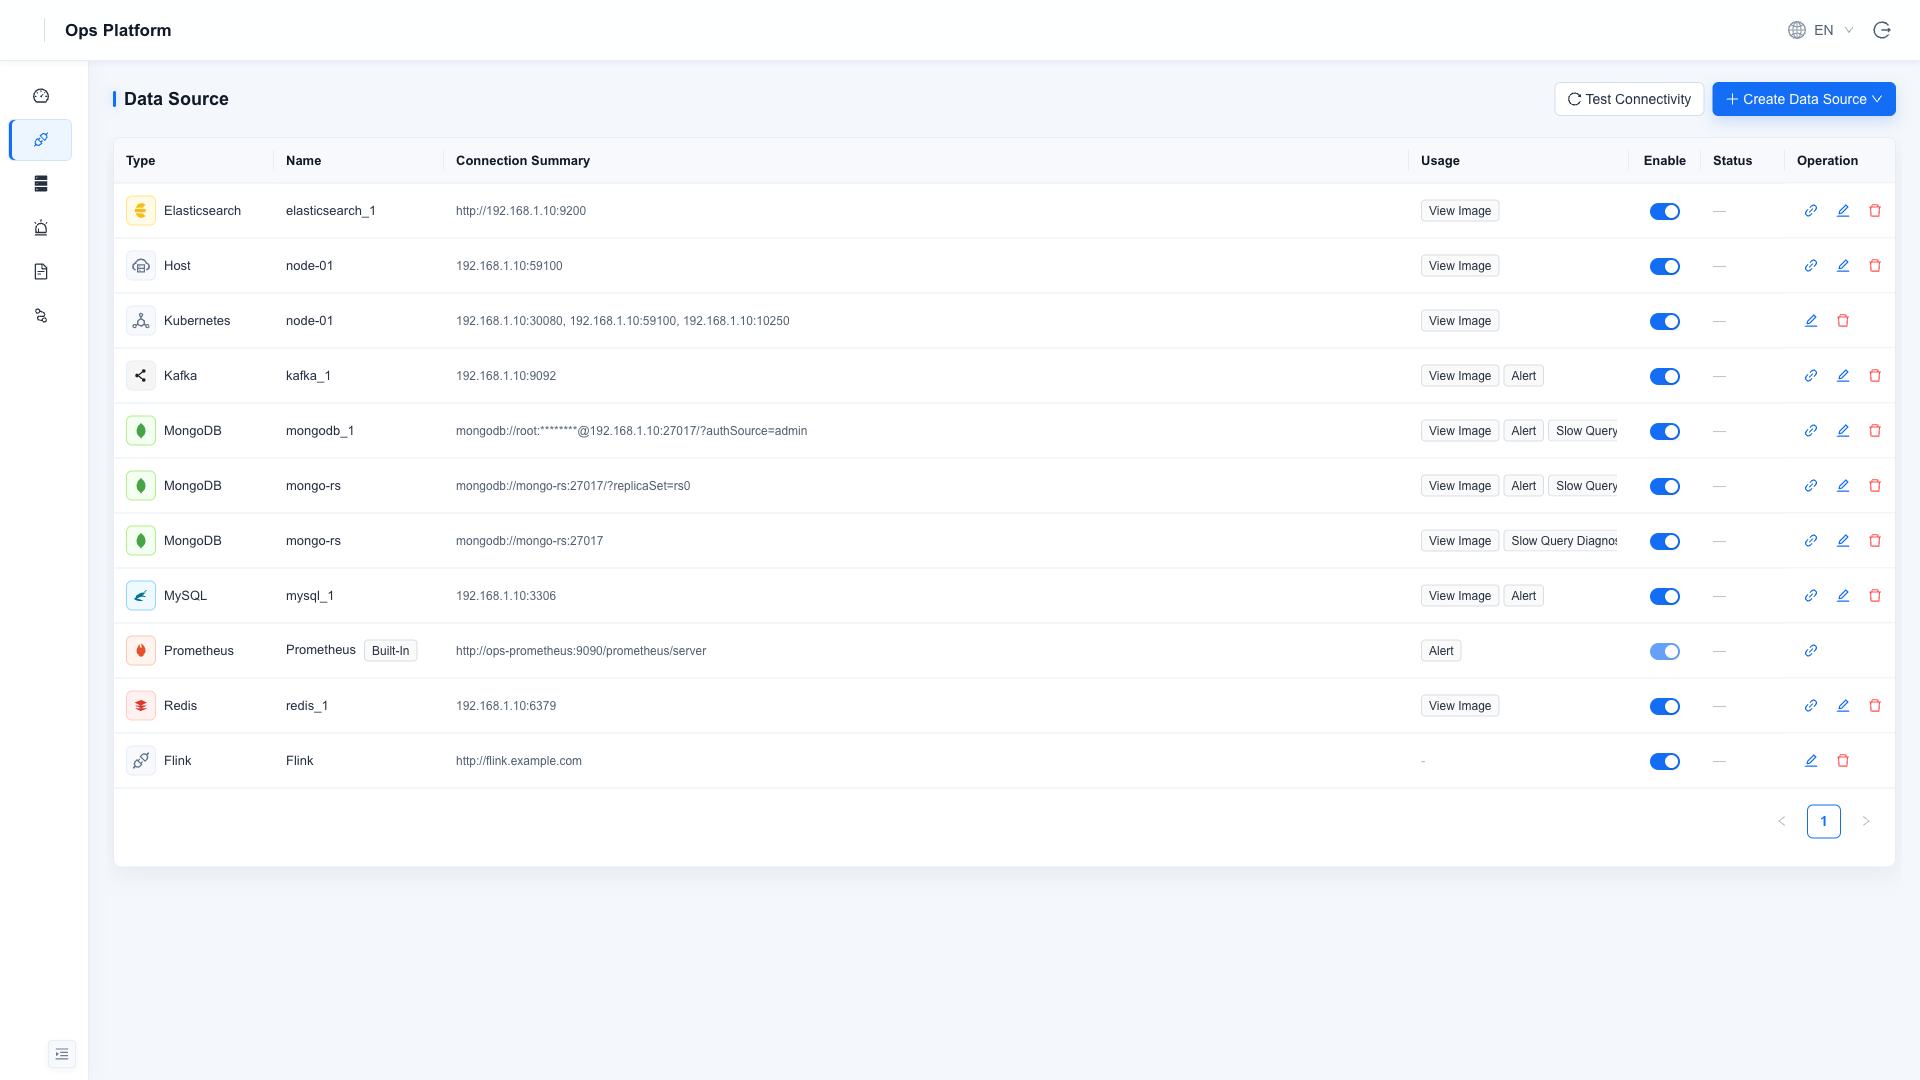
Supported Types
| Type | Multiple Instances | Connection Method |
|---|---|---|
| Prometheus | Built-in singleton | Built-in metrics database of the Ops Platform; read-only and cannot be disabled or deleted |
| Host | ✅ | Host address (port connectivity and related monitoring) |
| MySQL | ✅ | Node addresses (multiple allowed; each node collected separately)/username/password |
| MongoDB | ✅ | Connection URI, replica sets supported |
| Redis | ✅ | Node addresses (multiple allowed; list every Sentinel/Cluster node)/password/DB |
| Kafka | ✅ | Broker addresses, SASL supported |
| Elasticsearch | ✅ | Node addresses (multiple allowed) + HTTP Basic authentication |
| Custom page | ✅ | Any Web UI address (such as Flink or Langfuse). Registered pages appear in the "Custom" sidebar group; see Custom Pages below |
Multiple MySQL/Redis/Elasticsearch nodes go into one data source (one host:port per line or comma-separated). Each node gets its own collector, so one unreachable node does not affect the others, and a Redis failover needs no configuration change.
Collection Status
Each data source in the list includes "Collection Status", used to determine whether the data source is being collected. Most collection issues can be located from this status first:
| Status | Meaning | Common Handling |
|---|---|---|
| Collecting | Normal; metrics are being written | |
| No Data | Collector process is running, but no metrics have been obtained | Usually account/password/permission issues. Hover to view the original reason |
| Stopped | Collector process is not running | Hover to view the exit reason (unreachable address, wrong port, authentication failure, etc.); the process retries automatically |
| Not Collected | Collection has not been started for this data source | Check whether the purpose includes "Diagram" and whether the data source is enabled |
| Unknown | Status is temporarily unavailable | Confirm that the ops-agent (middleware) or ops-prometheus (host) container has started |
Hovering over a red status displays the original failure reason (for example, 401 unable to authenticate user or connection refused) and provides troubleshooting commands that can be copied directly. When dashboards have no data, check collection status first.
Host (node_exporter) is deployed on the monitored host and scraped directly by the Ops Platform Prometheus, without going through ops-agent.
Therefore its collection status is derived from Prometheus scrape results and differs from other data source types:
- A newly registered host may briefly show "Not Collected"; after about 30 seconds, the scrape target is delivered and the status changes to "Collecting".
- If the address is configured but the peer is not node_exporter, or the port is unreachable, the status is "No Data".
- If the Ops Platform Prometheus itself cannot be queried, the status is "Unknown". This means the status cannot currently be determined and does not necessarily mean collection failed.
The troubleshooting command shown on hover probes the host address (curl http://host:port/metrics); it is not an instruction to enter the agent container.
Where Configuration Takes Effect
Collection configuration uses this page as the only source. Creating data sources, changing passwords, enabling, and disabling are all done on this page. Changes take effect immediately without restarting containers.
Since 1.5.0,
ops.yamlno longer participates in data source configuration. It only describes the Ops Platform's own dependencies, not monitoring targets.
To connect multiple instances at once, use "Batch Import" in the upper-right corner: download the YAML template, change the connection addresses to the current environment, and upload it. It is recommended to click "Validate Only" first, which performs format validation and per-entry connection probing without writing data. Import is idempotent by "type + name". The same file can be imported repeatedly. Leave passwords empty when updating existing entries to keep the original passwords.
Export Configuration (Backup/Migration)
"Export Configuration" in the upper-right corner exports all current data sources as YAML in the same format as batch import. The exported file can be restored through "Batch Import" for backup, reinstall recovery, or migration across environments.
Two options are available:
| Option | Password | When to Use |
|---|---|---|
| Export configuration (without passwords) | Empty | Daily backups and import back to the same Ops Platform. Empty does not mean clearing passwords; during import, existing passwords in the Ops Platform are reused automatically by "type + name" |
| Export configuration (with plaintext passwords) | Plaintext | Migration to another Ops Platform, or recovery when the original Ops Platform database is unavailable. The file contains plaintext passwords; store it properly and never commit it to a code repository |
The password-free option also removes embedded credentials from MongoDB URIs (mongodb://user:pass@host → mongodb://host).
When restoring to another environment, fill in the credentials again. The file header comments also describe this behavior.
Purposes
Each data source can select one or more purposes, which determine the feature scope it participates in:
| Purpose | Effect |
|---|---|
| Diagram | Displays the instance dashboard in the corresponding "Resource Monitoring" menu |
| Alert | Allows alert rules to be created for the instance |
| Slow Query Diagnostics | MongoDB only: enables slow query analysis and index diagnostics. ⚠️ The Ops Platform enables profiling on the target database when it detects profiling is not enabled (db.runCommand({profile:1, slowms:100}); the threshold is controlled by ENV_GATEWAY_PROFILE_SLOW_MS). This is the only write the Ops Platform performs on the monitored database. Indexes are not created automatically; users must click "Create" on the diagnostics page. Diagnostic history is written only to the Ops Platform's own ops-mongo |
Custom Pages (External Web UI)
Custom pages mount any existing Web UI (Flink Web UI, Langfuse, internal dashboards, etc.) into the "Custom" sidebar group. They are not monitored data sources and collect no metrics. Choose "Custom page" from the "New Data Source" dropdown; any number of pages can be added.
| Field | Description |
|---|---|
| Name | Shown in the "Custom" sidebar group. The path /custom/<id> is derived from the name and does not change afterwards |
| Page URL | The http(s) address of the target Web UI |
| Embedding mode | Reverse proxy: forwarded by the Ops Platform, same-origin with platform authentication; the target only needs to be reachable from the Ops Platform server. Suitable for services whose assets use relative paths (such as Flink). Direct iframe: the browser loads the target directly; the target must be reachable from the browser and must allow iframe embedding. Applications whose assets use absolute paths (Next.js apps such as Langfuse) only work in this mode |
A wrong embedding mode shows up as a blank page: 404s on page assets under reverse proxy → switch to direct iframe; X-Frame-Options/frame-ancestors errors in the browser console under direct iframe → relax the restriction on the target or switch to reverse proxy.
The address is probed on save; a target with its own login page returning 401/403 still counts as reachable. If the probe fails you can save anyway—the page opens normally once the network is available.
The former singleton "Flink" entry is migrated automatically into a custom page (reverse proxy mode). The sidebar entry and URL stay the same; no manual action is required.
Custom pages are included in "Export Configuration" and "Batch Import". YAML form:
  - kind: customPage
    name: Langfuse
    url: http://langfuse:3000
    mode: iframe        # proxy = reverse proxy / iframe = direct iframe
    enabled: true
Account Permissions for Monitored Targets
Before registration, prepare accounts with the required permissions for each monitored target. The Ops Platform is read-only oriented by default:
| Target | Required Permissions |
|---|---|
| MySQL | SELECT, SHOW DATABASES, PROCESS, REPLICATION CLIENT |
| MongoDB | root recommended; see the minimum-permission example below |
| Redis | Data read permission |
| Kafka | If authentication is enabled, permission to read cluster metadata |
| Elasticsearch | Read/write index permissions |
| Custom page | Reverse proxy mode: the target address must be reachable from the Ops Platform server. Direct iframe mode: the target must be reachable from the browser and must not restrict embedding via X-Frame-Options/frame-ancestors |
Minimum MongoDB permissions (readWrite/dbAdmin are used for index creation during slow query diagnostics):
use admin
db.createUser({
  user: "opsuser", pwd: "your_secure_password",
  roles: [
    { role: "clusterMonitor", db: "admin" },
    { role: "readAnyDatabase", db: "admin" },
    { role: "clusterManager", db: "admin" },
    { role: "dbAdmin", db: "mdwsrows" },     { role: "readWrite", db: "mdwsrows" },
    { role: "dbAdmin", db: "mdservicedata" }, { role: "readWrite", db: "mdservicedata" },
    { role: "dbAdmin", db: "mdworksheet" },   { role: "readWrite", db: "mdworksheet" },
    { role: "dbAdmin", db: "mdworkflow" },    { role: "readWrite", db: "mdworkflow" }
  ]
})
Elasticsearch Account Fields
A common failure is connection succeeds but no metrics are collected, usually caused by an incorrect username. When "Test Connection" is clicked, the Ops Platform also checks the collection status and will directly report "Connection succeeded, but no data has been collected yet" for this case.
| Item | Value |
|---|---|
| URL | http://<ES-address>:9200, including the protocol |
| Username | md — the built-in ES username in private deployment is md, not elastic |
| Password | ES password set during HAP/HDP deployment |
To determine whether data has been collected, check whether the "Collection Status" column is Collecting, or click "Test Connection" directly. If "No Data" is displayed, hover to view the reason. Credential errors directly indicate that the account or password is incorrect.
Operations
- Create: Click "New Data Source" in the upper-right corner → select type → enter connection information.
- Test Connection: Uses real credentials for authentication checks (MongoDB ping, MySQL login, Kafka metadata fetch, Redis AUTH, ES authentication request), not only port connectivity. It also verifies collection status. Connectivity success does not mean dashboards already have data; target delivery, collector process, and metrics scraping status must also be confirmed. The result clearly shows "Connection succeeded, collecting" or "Connection succeeded, but no data has been collected yet" and provides the reason.
- Connectivity Check: The upper-right button runs the above checks in batch for all data sources in the list. The "Status" column shows Connected·Collecting/No Data/Degraded/Unreachable.
- Enable/Disable: Toggle the list switch. After disabling, the corresponding resource monitoring menu and alert types are automatically hidden, and existing alert rules stop scheduling.
- Edit: Stored passwords are shown as masks. Leave blank to keep unchanged.
Passwords and connection URIs are encrypted with ENV_ALERT_CRYPTO_KEY before being written to the database, and APIs return masks uniformly. Set this key during first deployment and keep it safe. Changing the key prevents saved credentials from being decrypted and requires re-entry.
After Registration
After data sources are registered and collection status is normal:
- Resource Monitoring: View dashboards for each instance
- Alert Rules: Configure alerts for instances
- Slow Query Diagnostics: MongoDB only; select the purpose first