Resource Monitoring
Provides visual dashboards for targets such as hosts, middleware, and Kubernetes clusters. The left-hand submenu is generated dynamically based on the enabled types in Data Sources—only the dashboard types whose data sources are enabled are shown.
Submenus
| Submenu | Data Source |
|---|---|
| Host | node_exporter |
| MySQL | mysqld_exporter |
| MongoDB | mongodb_exporter |
| Redis | redis_exporter |
| Kafka | kafka_exporter |
| Elasticsearch | elasticsearch_exporter |
| Kubernetes | kube-state-metrics / kubelet; see Kubernetes Cluster Monitoring |
| Flink | Flink Web UI (reverse proxy) |
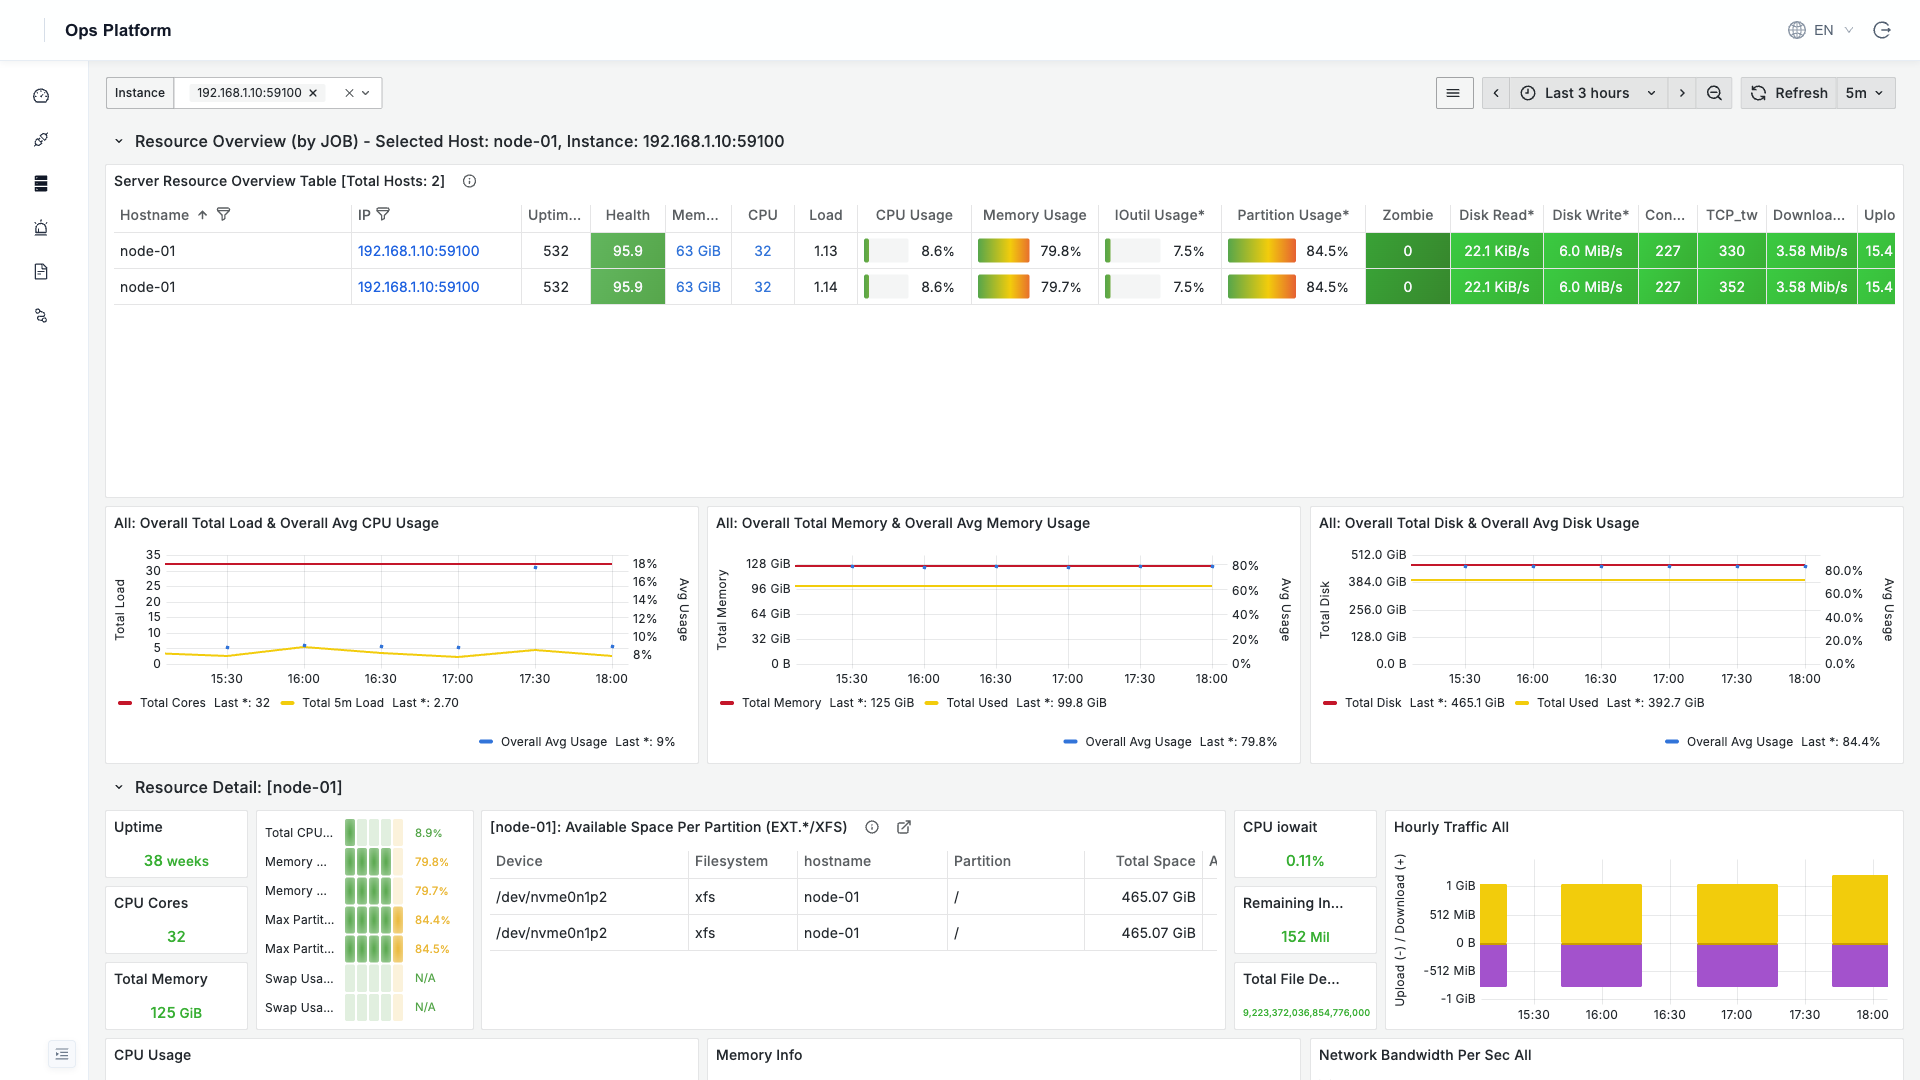
Host Monitoring
The Host page aggregates a resource overview of all hosts: at the top is a detailed resource table for every host (CPU / memory / load / disk / partition usage, zombie processes, health score, etc.), and below it are per-host time-series details for CPU, memory, disk, and network. Click a host IP to drill down into that host's full dashboard.
Middleware Monitoring
Each middleware type has its own dedicated dashboard. Use the Instance dropdown at the top to switch between multiple instances of the same type.
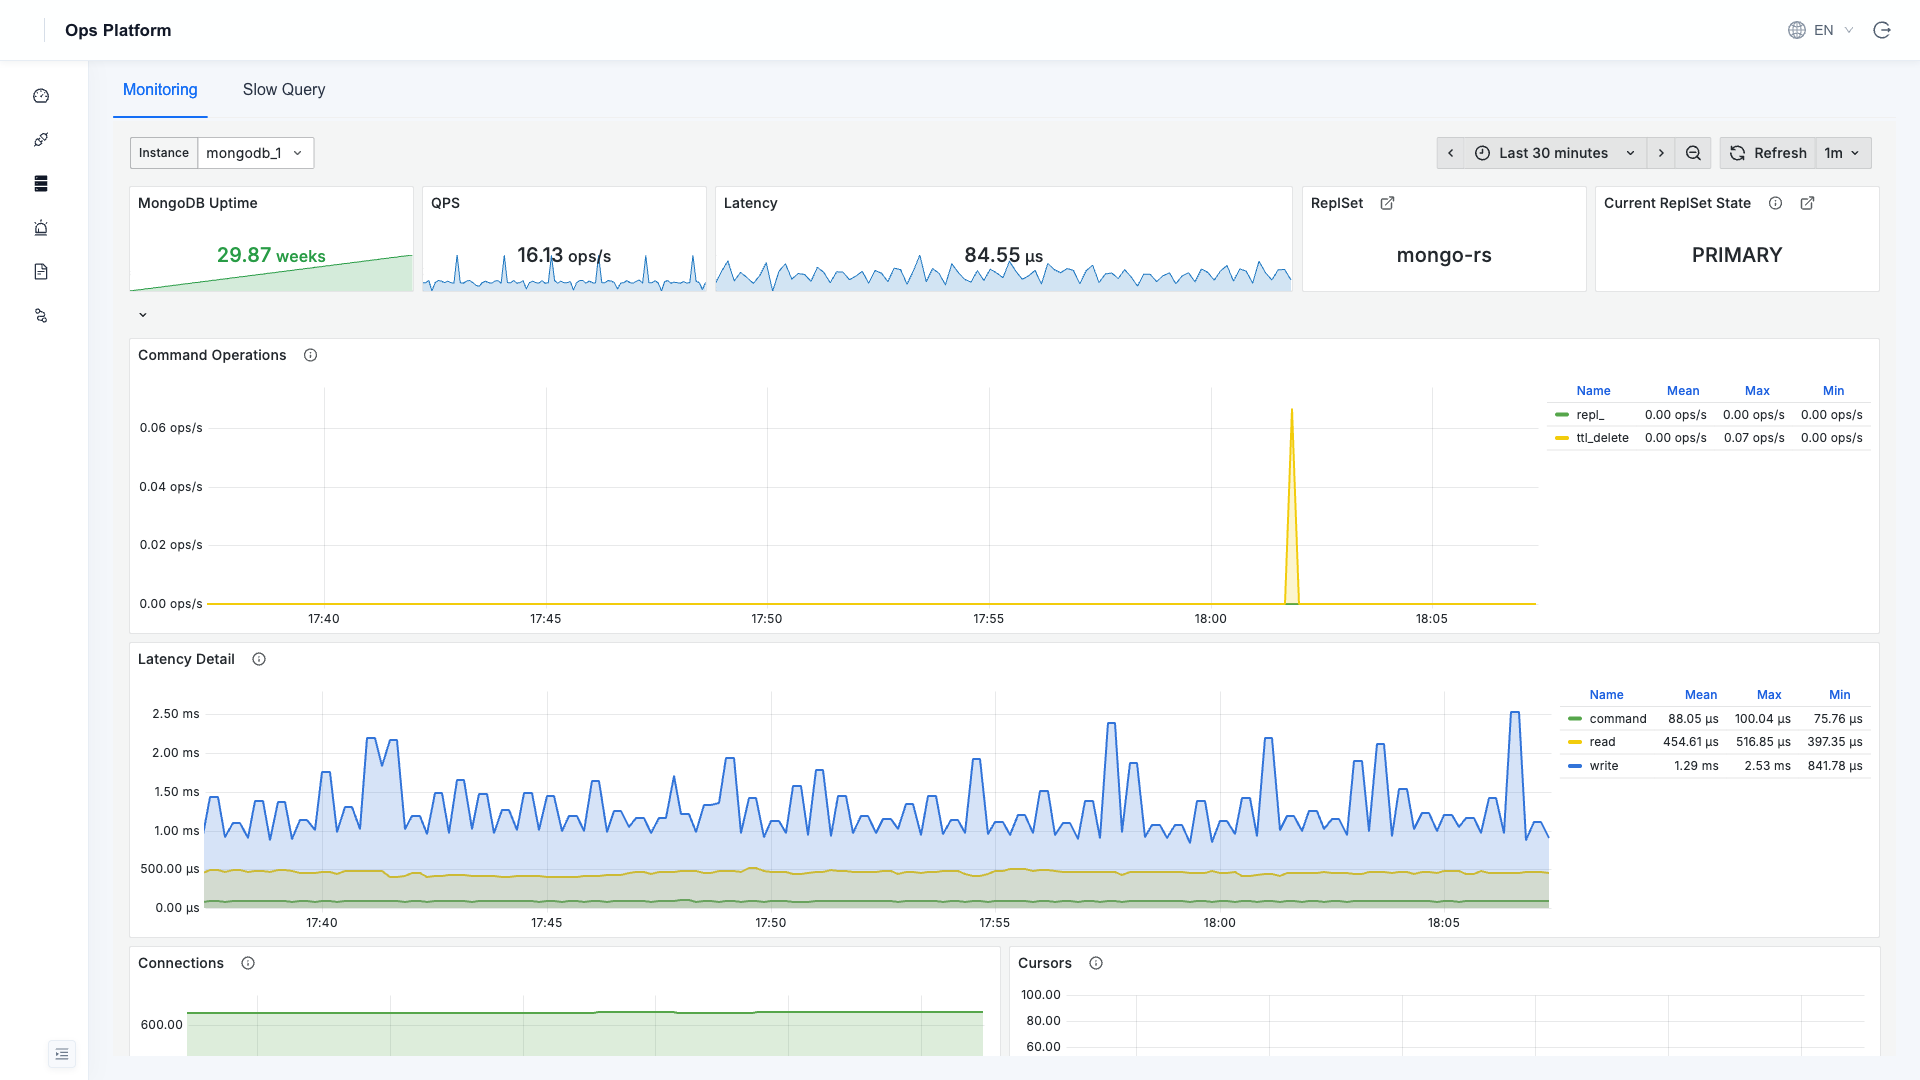
MongoDB
Uptime, QPS, latency, replica set role, command operations, connections, query efficiency, and more; two tabs at the top, Monitoring / Slow Query, where Slow Query is MongoDB Slow Query Analysis.
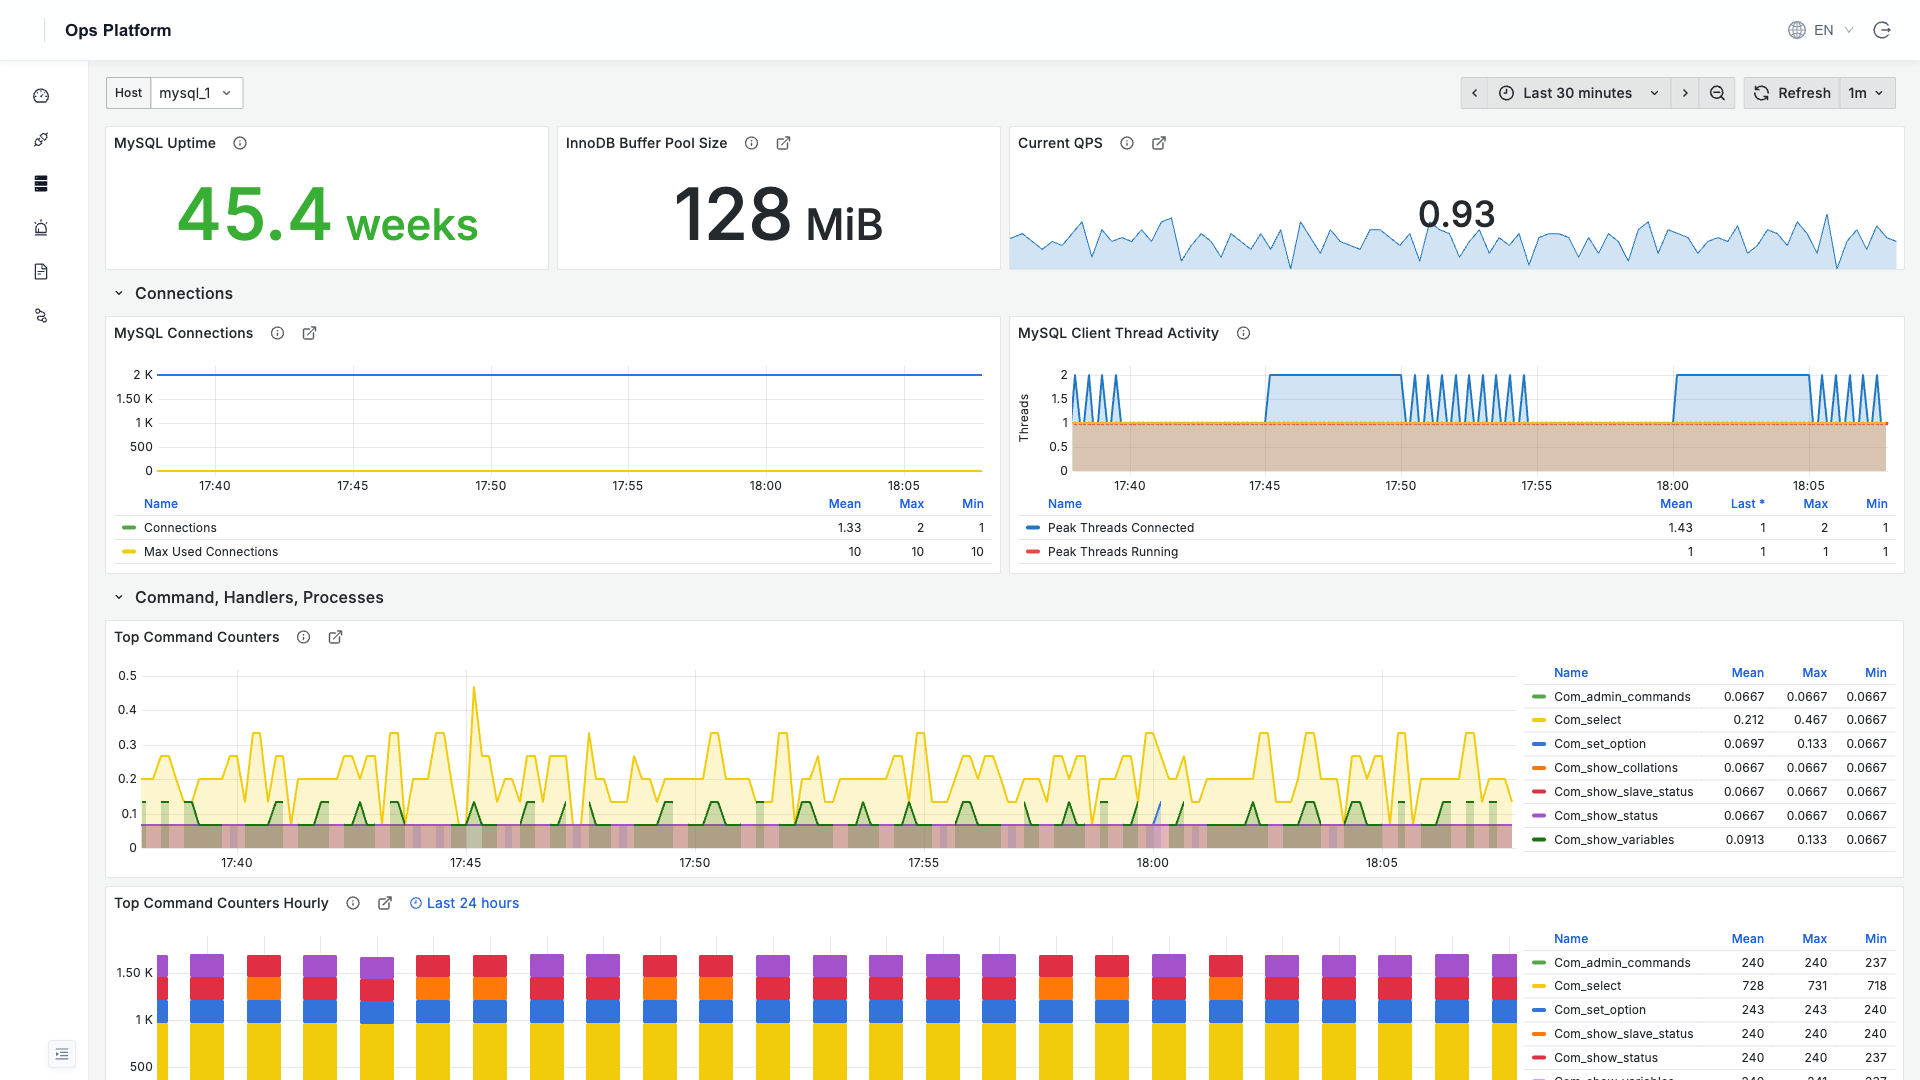
MySQL
Uptime, QPS, connections, InnoDB buffer pool, client thread activity, command statistics, and more.
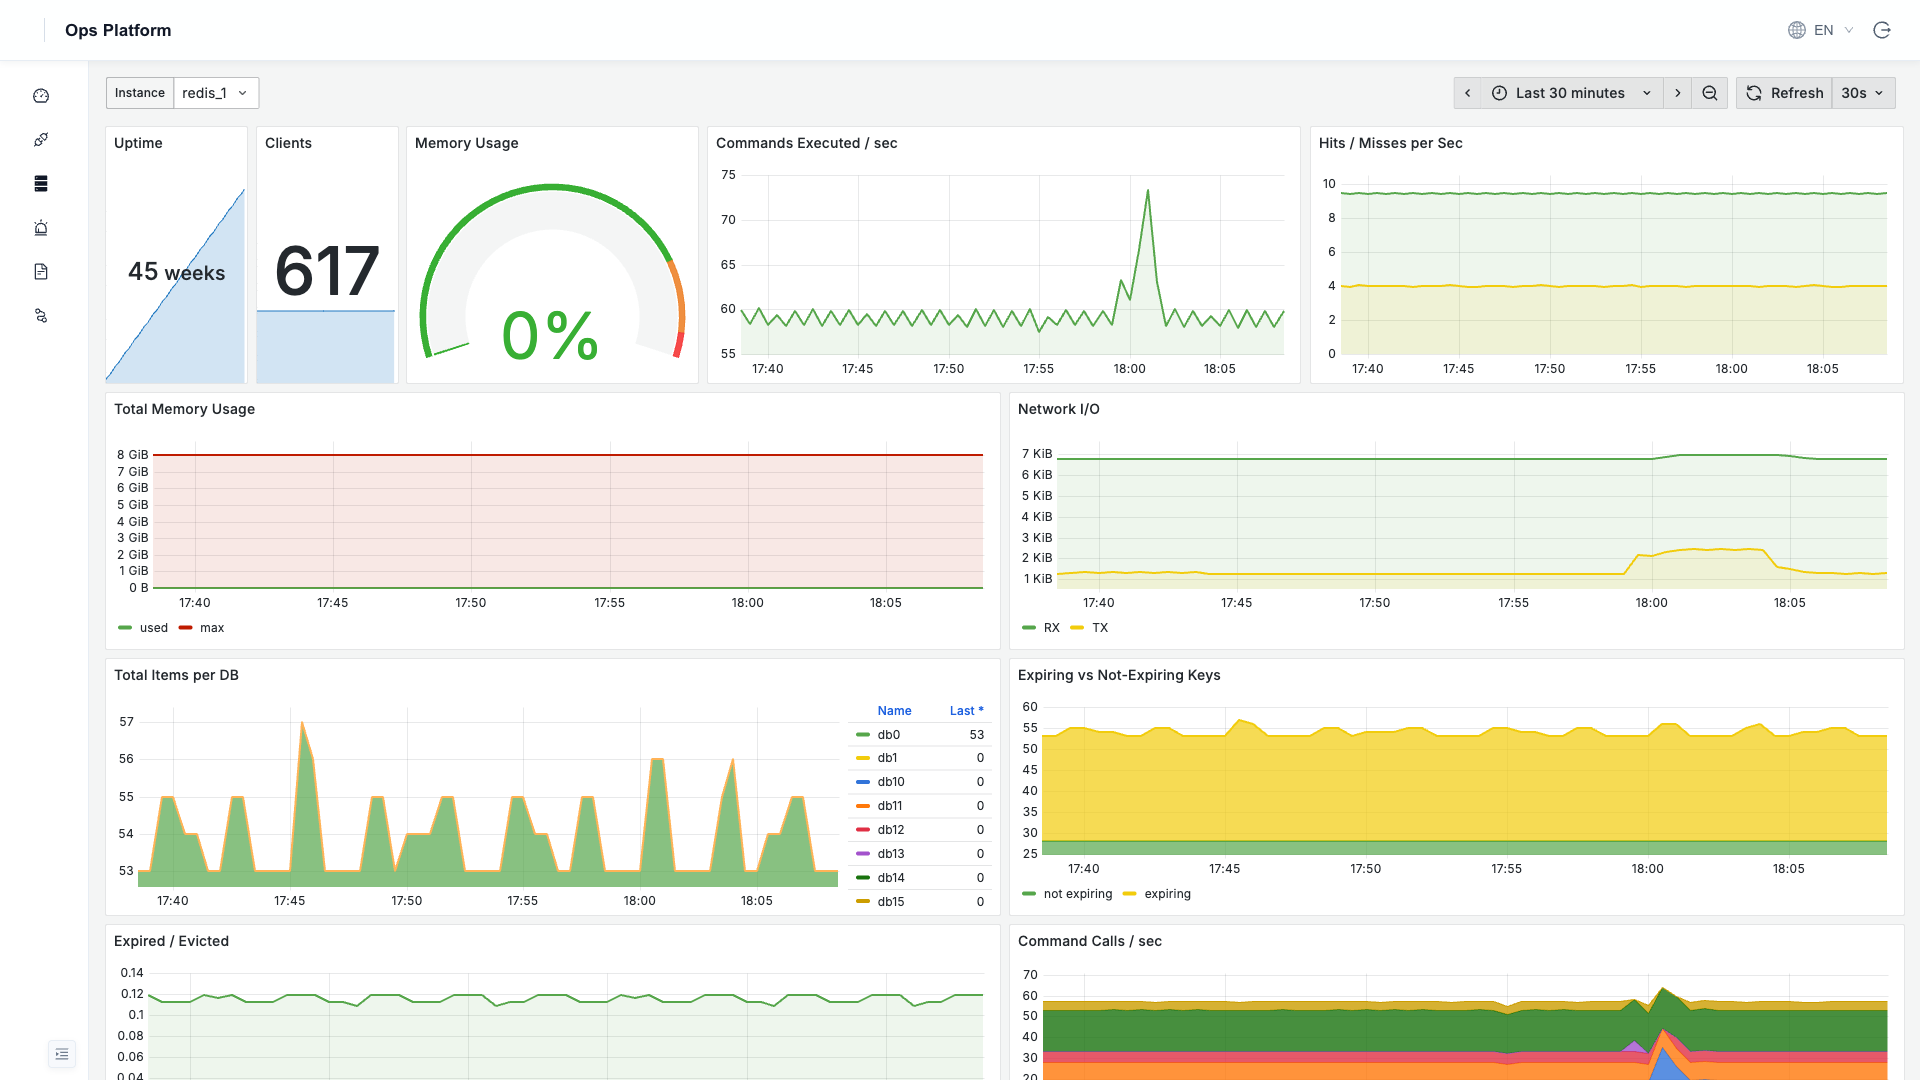
Redis
Uptime, connections, memory usage, command execution / hit rate, network I/O, key counts per DB, and more.
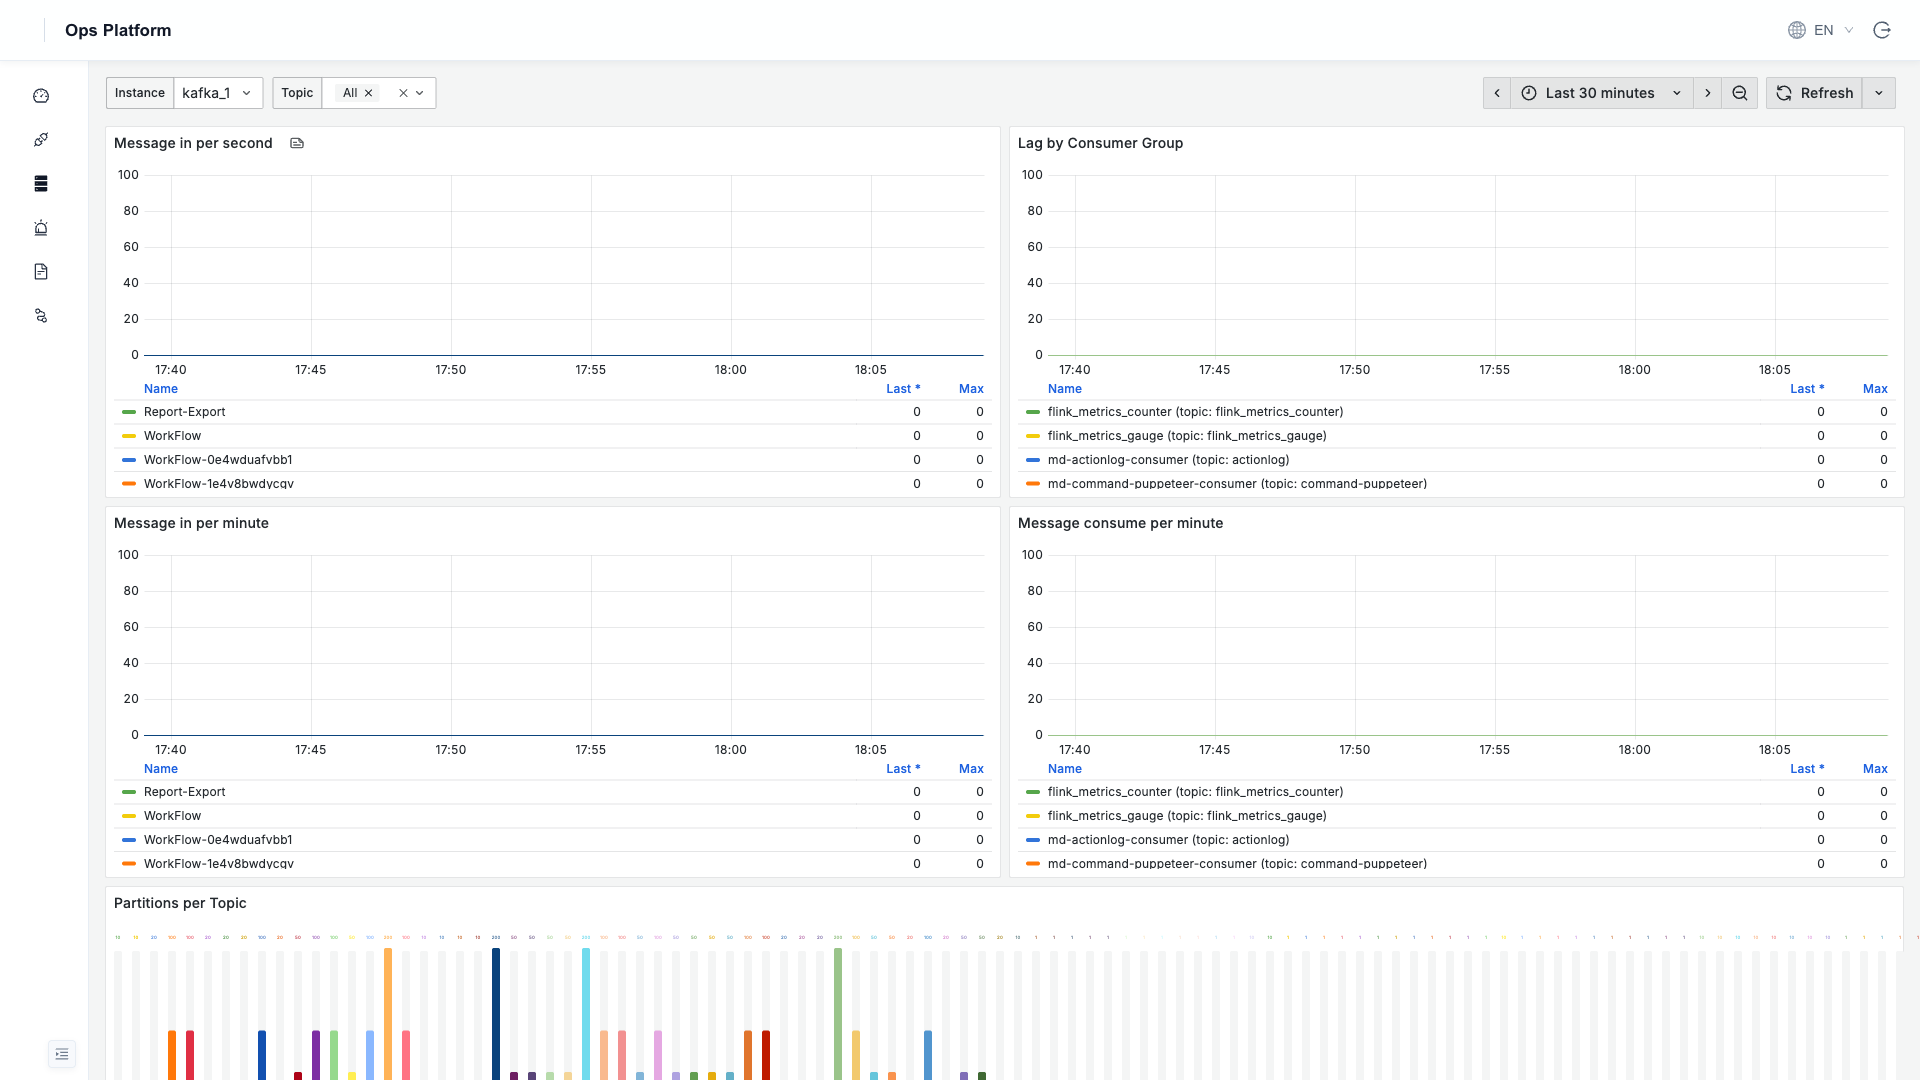
Kafka
Message production / consumption rates, consumer group lag, topic partition distribution, and more.
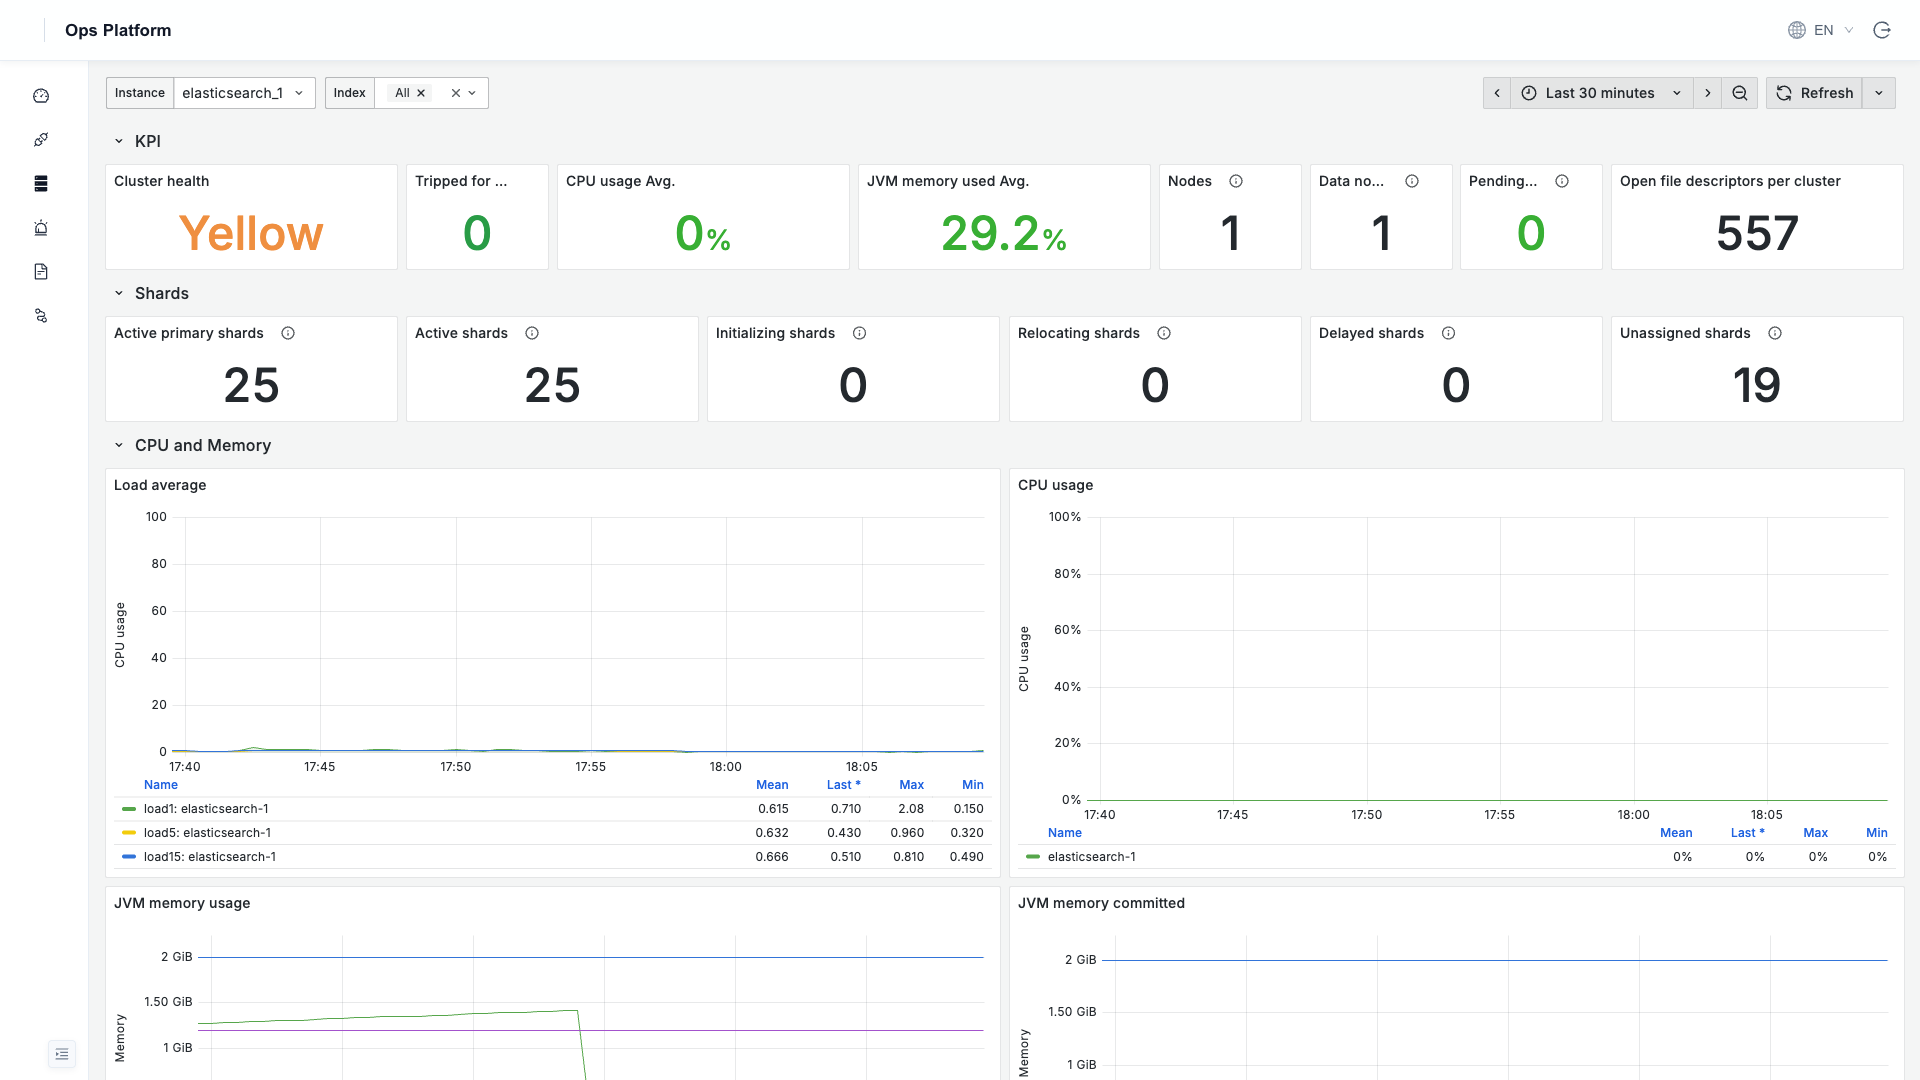
Elasticsearch
Cluster health, shard status, node CPU / JVM heap memory, disk and network, document indexing rate, and more.
Working with Dashboards
Resource monitoring dashboards are embedded from Grafana. Common operations:
- Instance selector: use the
Instancedropdown at the top left of a dashboard to switch between multiple instances of the same type. - Time range: switch the time window at the top right (default last 3 hours / 30 minutes), with support for custom ranges and auto-refresh.
- Expand / collapse: click a group row's title within a dashboard to expand or collapse it.
Dashboard content is in English (Grafana custom dashboard text does not follow the platform language; it is kept in English for cross-language consistency). Dashboard titles, legends, and metric definitions have no effect on the data itself.
Kubernetes and Flink
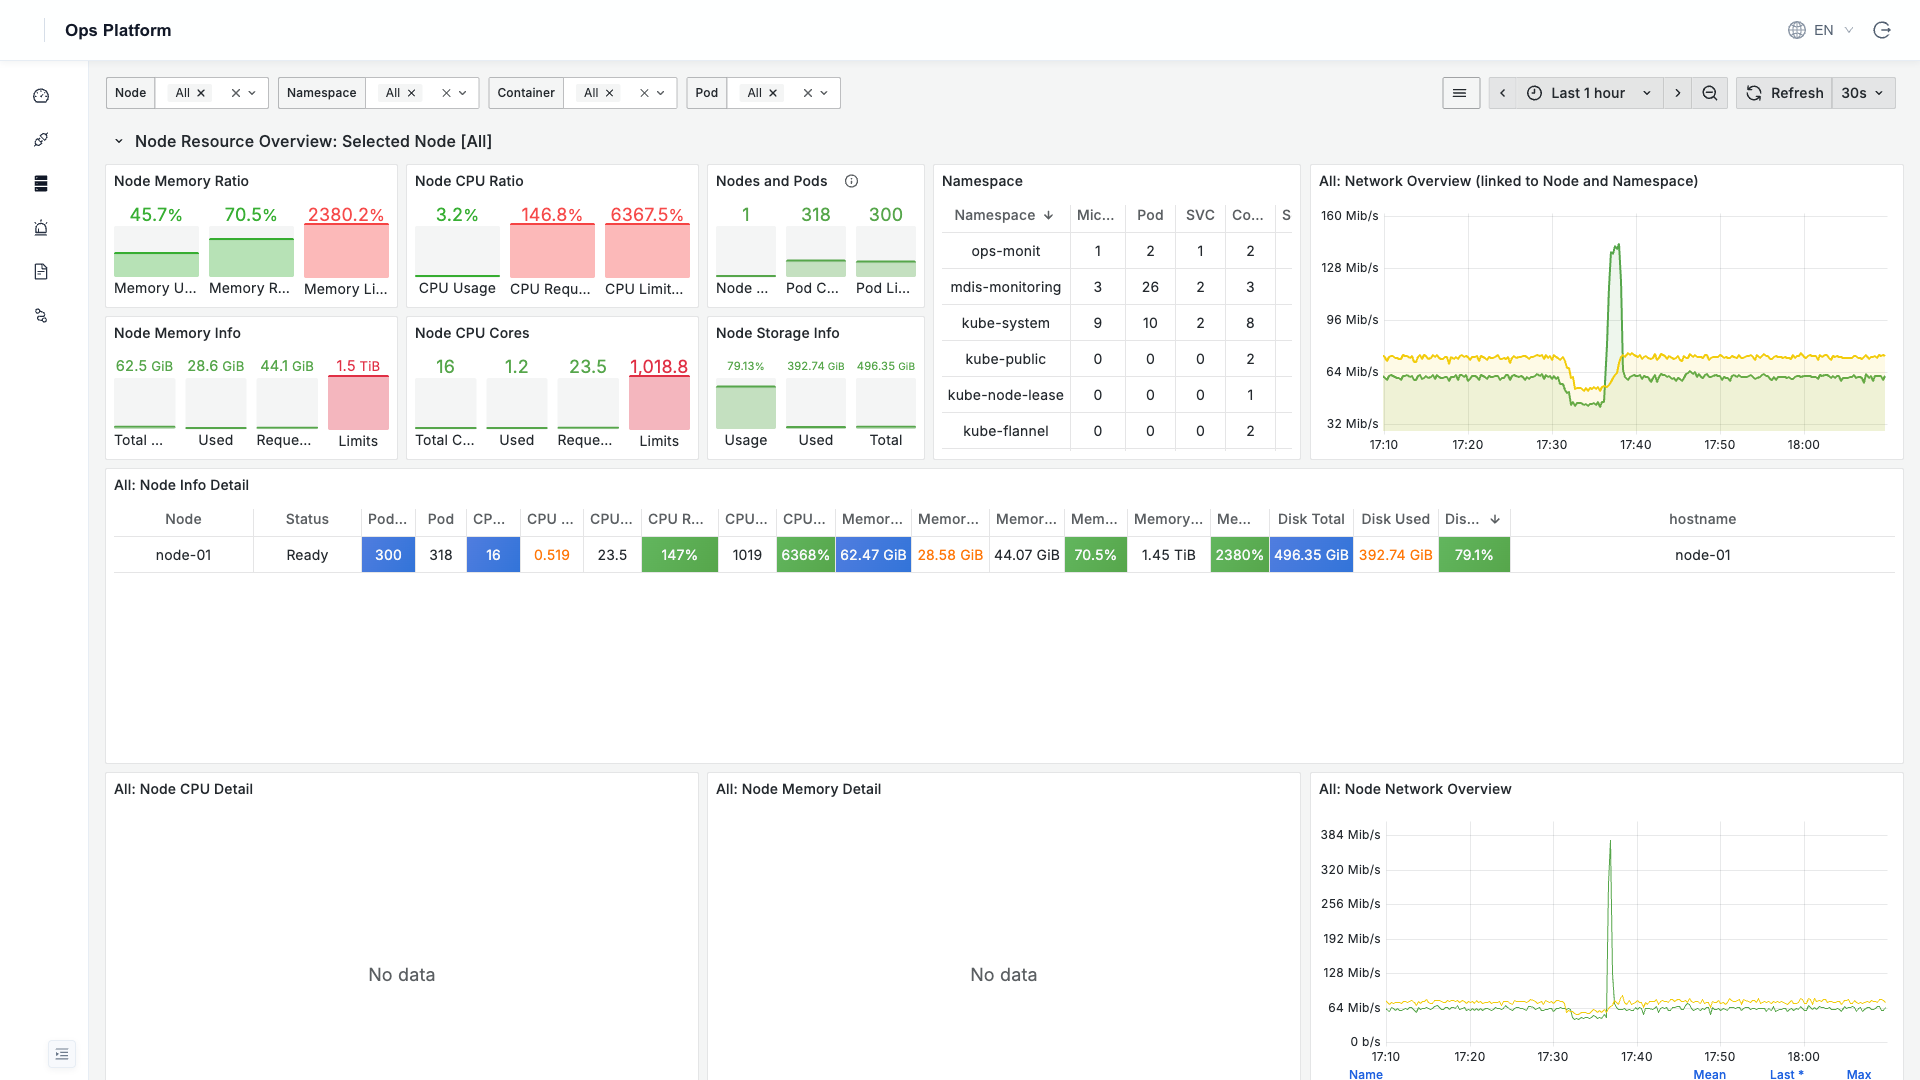
Kubernetes: monitors cluster nodes, containers, Pods, and cluster object status (node resources, namespaces, CPU / memory quotas, Pod distribution, etc.). This requires configuring the collection components as described in Kubernetes Cluster Monitoring.
Flink: once the Flink entry is enabled, the platform embeds Flink's native Web UI directly through a dynamic reverse proxy, with no need to separately open ports.