Alert Rules
Configure rules through a graphical interface under Alert Management → Alert Rules. Common scenarios require no PromQL (custom expressions are also supported).
caution
Thresholds and notification policies should be owned by operations staff—misconfiguration can cause false positives or missed alerts. Validate in a test environment before rolling out to production.
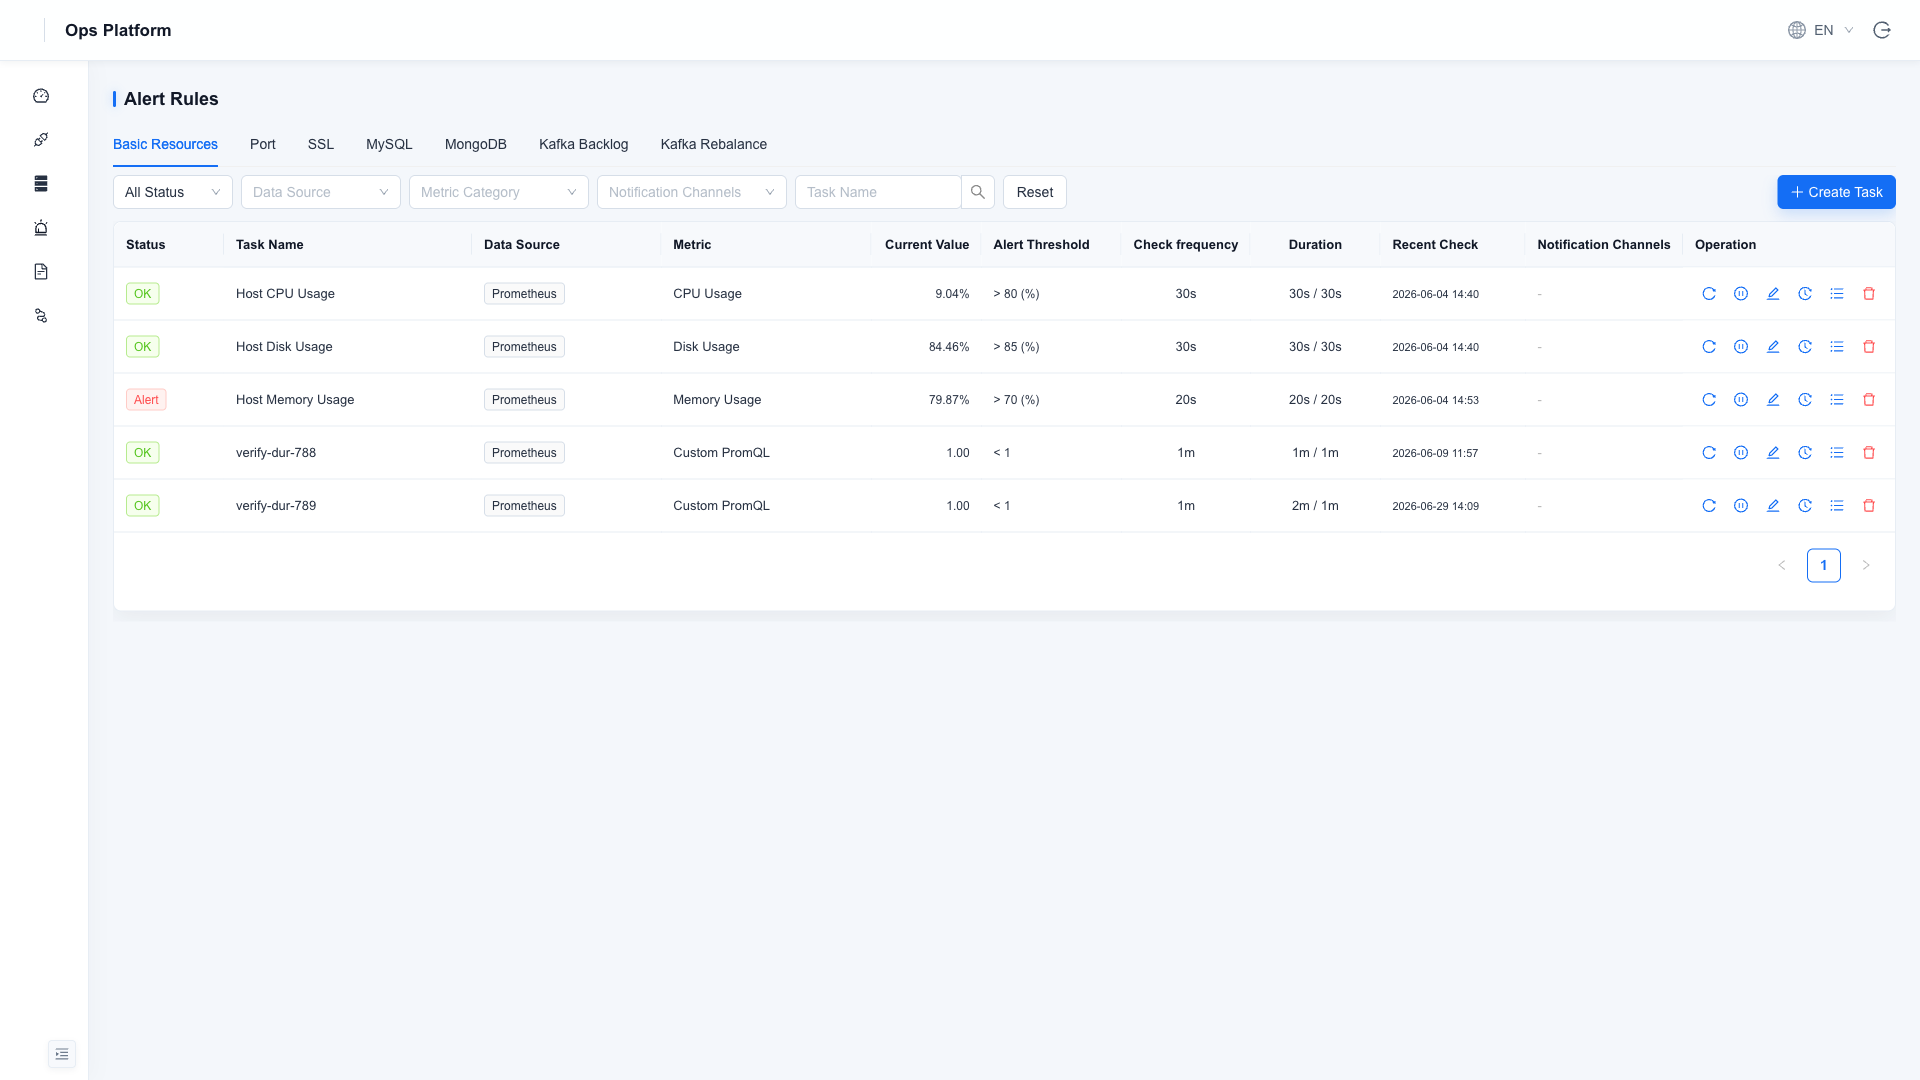
Monitoring Types
The rules page is organized into tabs by type. Middleware types appear only after the corresponding data source is enabled:
| Tab | What It Monitors | Condition |
|---|---|---|
| Basic Resources | CPU, memory, disk, and other metrics of hosts / middleware; supports custom PromQL | Always |
| Port | TCP port connectivity probing | Always |
| SSL | HTTPS certificate validity period | Always |
| MySQL | Connections / slow queries and other specialized checks | MySQL data source enabled |
| MongoDB | Connections / replication lag and other specialized checks | MongoDB data source enabled |
| Kafka Backlog | Consumer group lag buildup | Kafka data source enabled |
| Kafka Rebalance | Frequent consumer group rebalancing | Kafka data source enabled |
Creating a Rule
Click New Task and fill in the fields as prompted:
| Field | Description |
|---|---|
| Task name | Unique and readable, e.g. Production host CPU too high |
| Data source | The target instance to monitor |
| Metric | Choose from built-in metrics, or select Custom PromQL to write an expression directly (results can be previewed) |
| Alert threshold | Operator + threshold, e.g. > 80 |
| Check frequency | How often the check runs |
| Duration | How long the value must stay over threshold before entering the alert state, filtering out transient spikes |
| Notification channel | Bind a notification channel; if none is bound, the alert is only recorded in the platform |
State Transitions
A built-in noise-reduction state machine notifies only on state changes, so a continuously firing alert does not repeatedly spam notifications:
Normal ──over threshold──▶ Warning (Pending) ──duration met──▶ Firing ──recovered──▶ Recovered
| State | Meaning |
|---|---|
| Warning (Pending) | Over threshold, duration not yet met |
| Firing | Over threshold and duration met; notification already sent |
| Recovered | Recovered from firing to normal; recovery notification sent |
| Paused | Rule manually paused; no longer scheduled |
Common Operations
- Check now: skip the wait and run a check immediately.
- Pause / enable: temporarily stop scheduling during planned maintenance (replaces the old "alert silence").
- Instance details: view the current value for each instance the rule matches; supports per-instance silencing to mute individual instances while the rule as a whole keeps running.
- Alert history: view this rule's trigger records; for the global view, see Alert History.