Log Query
Loki-based log retrieval. The left-hand Log Management section has two panels, divided by source:
| Panel | Source | Use Case |
|---|---|---|
| Container Console | Docker container stdout/stderr (collected by Alloy) | Troubleshooting middleware and infrastructure container logs (MySQL / Redis / Kafka, etc.) |
| Service Logs | HAP microservice structured JSON logs (pushed directly by serilog) | Troubleshooting business calls and exception stacks; searching by parameter (phone number / user ID / traceID) |
Both panels have a keyword search (full-text, case-insensitive) and multi-select dropdown filters at the top. The time window defaults to the last 1 day and can be adjusted at the top right.
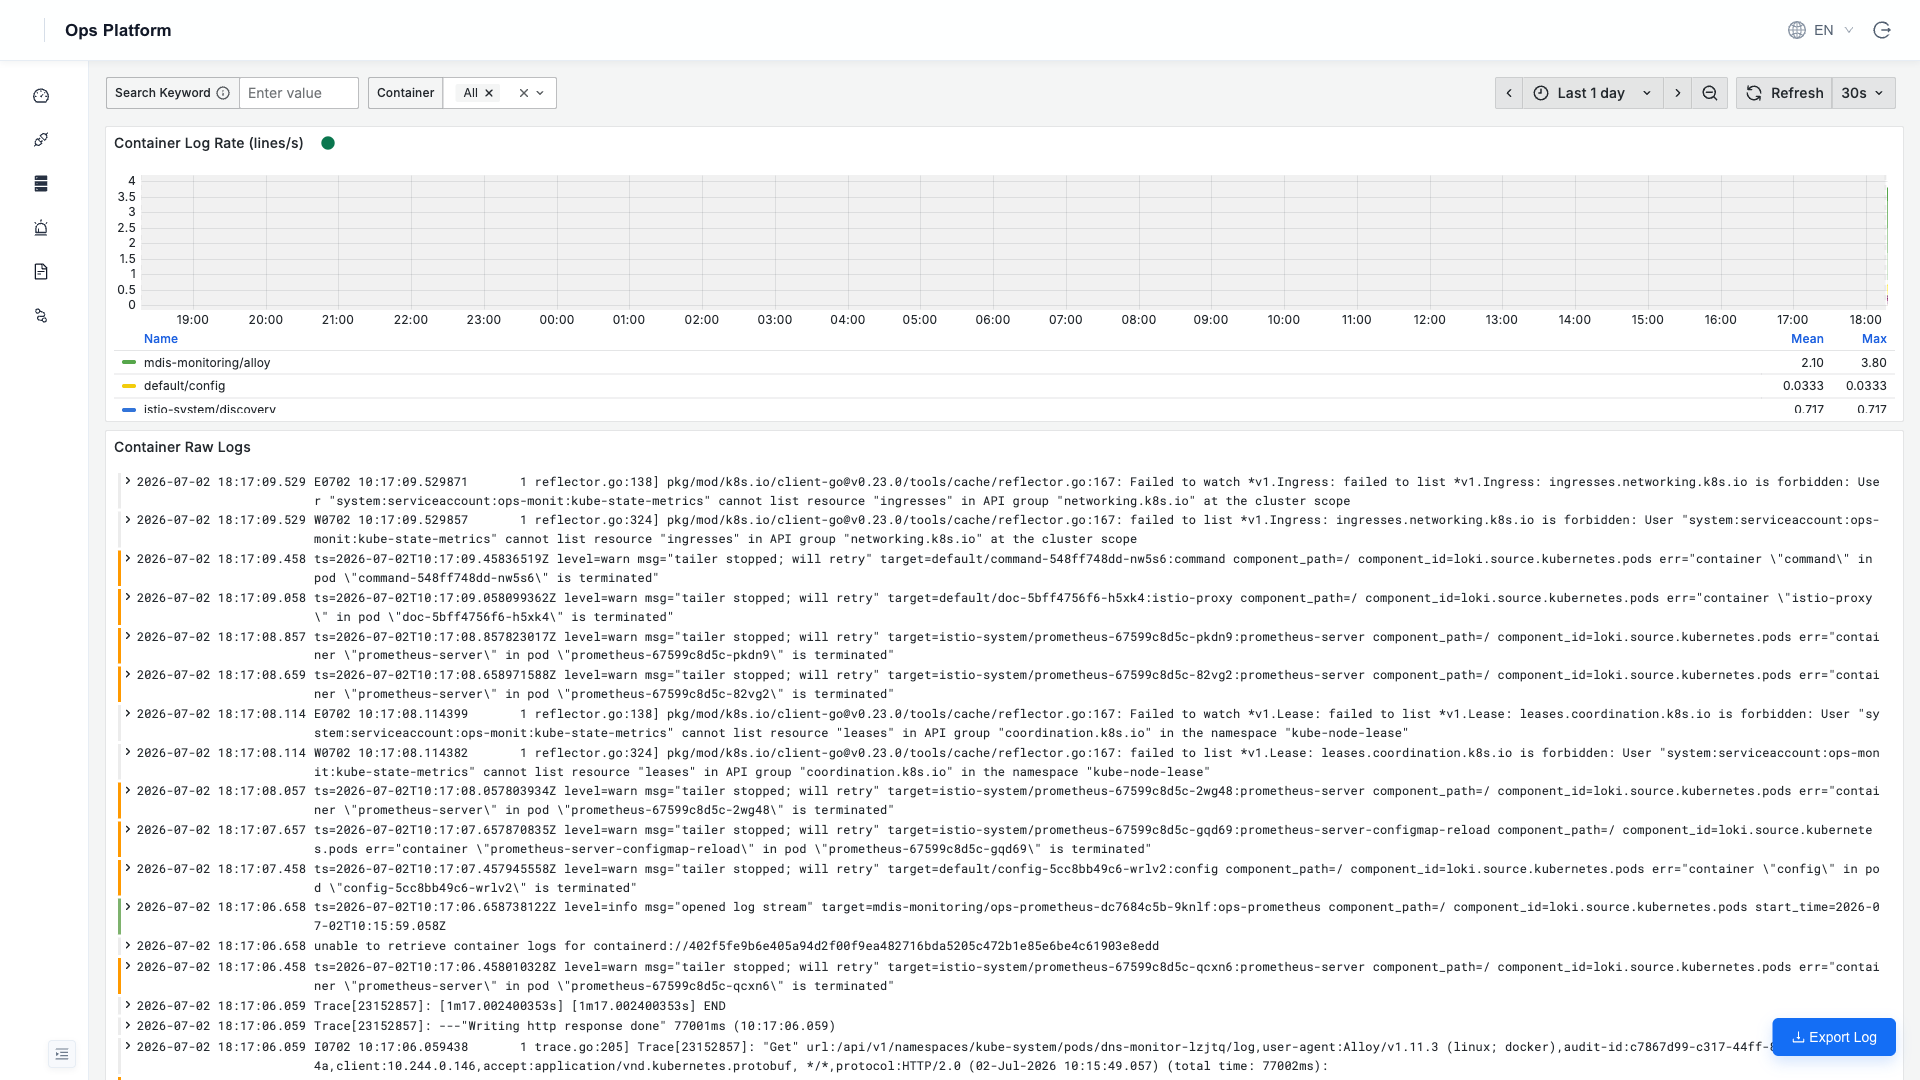
Container Console
Select a container name from the Container dropdown (such as script-app-1 or milvus-etcd) to view that container's recent stdout; combine it with keyword search to pinpoint content.
Service Logs
Service Logs queries the structured logs that HAP microservices push into Loki through serilog.
Setup
Log shipping must be enabled explicitly on the HAP side, otherwise this page stays empty forever.
-
Set
ENV_LOKI_URLon the HAP side, pointing at this platform's Loki:ENV_LOKI_URL=http://<ops-platform-host-IP>:3100Put it with the other HAP environment variables (
docker-compose.yaml/.envfor single node, the corresponding ConfigMap for a cluster). -
Restart the HAP services so the variable takes effect.
-
Check connectivity — for cross-host deployments, HAP containers must reach port
3100on the ops platform host:# from any HAP containercurl -s -o /dev/null -w '%{http_code}\n' http://<ops-platform-host-IP>:3100/ready -
Trigger a business call (a login, a verification code): microservices only write logs once they actually handle traffic. Refresh this page afterwards.
ENV_LOKI_URL variables are different things- On the HAP private deployment side,
ENV_LOKI_URLis the write switch — empty by default, and nothing is written to Loki until it is set (the installer setsStoreInLokitofalseaccordingly). - On the Ops Platform side,
ENV_LOKI_URLis the query address, defaulting tohttp://ops-loki:3100, and needs no configuration in a standard topology.
You need the former. Changing only the latter has no effect — this is by far the most common misconfiguration.
Advanced LogQL
For complex queries (aggregation / statistics / regex), go to Grafana Explore (the Grafana icon at the bottom left → Explore) and write LogQL directly:
{service_name="smssenderservice", detected_level="error"}     # all errors from the SMS service
{hostname=~".+"} |~ "(?i)13800138000"                          # search a phone number across all services
sum(rate({hostname=~".+"}[5m])) by (service_name)              # per-service 5m log rate
For syntax, see the official LogQL documentation.
Logs are retained for 30 days by default (ENV_LOKI_RETENTION=720h), adjustable in ops.yaml / ConfigMap. If disk space is tight, consider configuring an S3/MinIO backend.