Ops Platform
Ops Platform is an all-in-one monitoring and diagnostics system built into the on-premises edition of HAP. It provides three core observability capabilities — metrics, logs, and traces — plus intelligent alerting for private-deployment environments, helping ops teams centrally track the health of infrastructure and middleware and pinpoint problems fast. Monitoring targets are onboarded non-intrusively, without changing business services, and all data stays inside the intranet.
Feature Overview
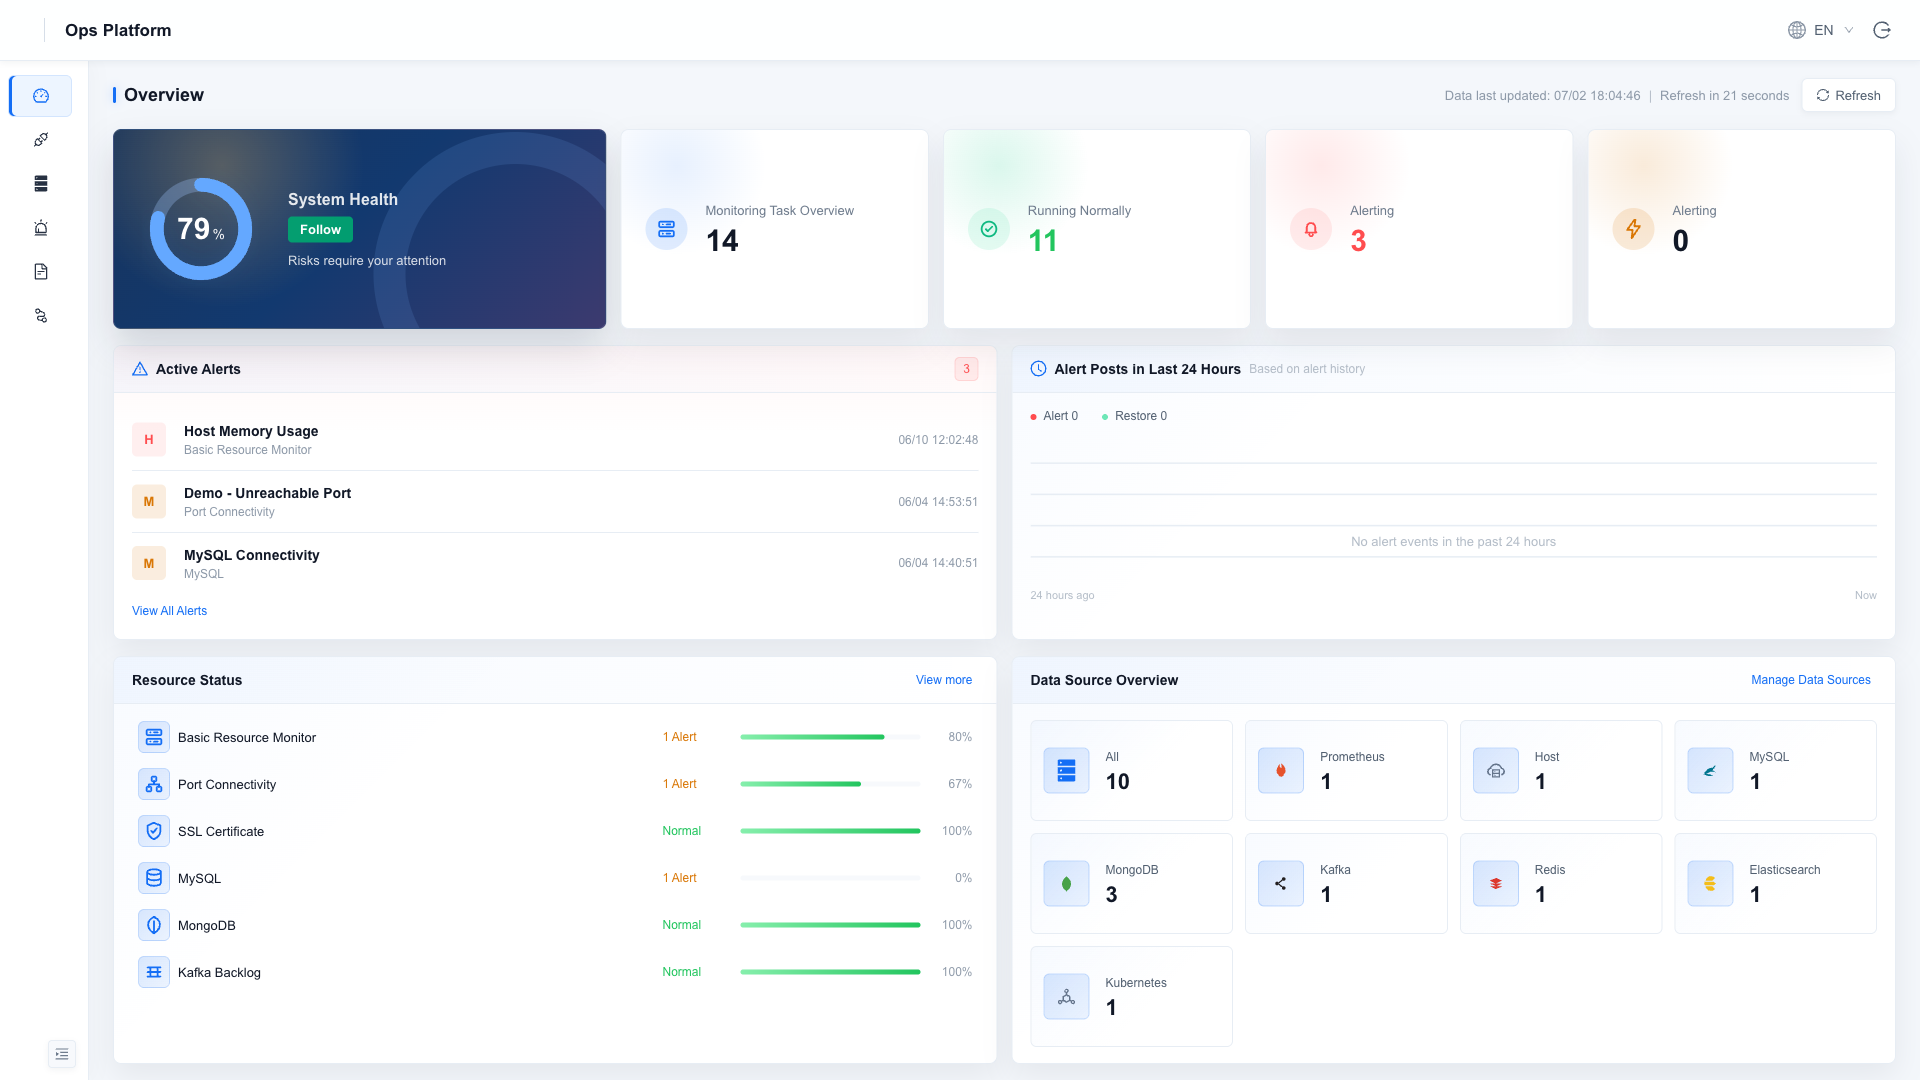
After logging in you land on the Overview, where you can see system health, the number of monitoring tasks, and the current alert distribution at a glance:
| Module | Capability | Docs |
|---|---|---|
| Overview | System health, monitoring task stats, active alerts, and alert activity over the last 24 hours | This page |
| Resource Monitoring | Visual dashboards for hosts, MySQL / MongoDB / Redis / Kafka / Elasticsearch middleware, Kubernetes clusters, and Flink | Resource Monitoring |
| Alert | Native alert rules for seven scenario types, built-in noise reduction, multi-channel notifications | Alert Rules |
| Logs | Loki-based container logs and structured HAP microservice log search | Log Search |
| Distributed Tracing (cluster only) | Tempo-based distributed trace analysis (request rate / error rate / latency / waterfall). Not available in single-node deployments, see below | Distributed Tracing |
| Slow Query Diagnostics | Automatic MongoDB slow query analysis with index optimization suggestions | MongoDB Slow Query Analysis |
Start deploying: Standalone (Docker Compose) · Cluster (Kubernetes). See the release notes for what changed.
All monitored targets are managed centrally on the Data Source page, and the selectable types for Resource Monitoring and Alert are dynamically driven by the data sources you have enabled.
A single-node (Docker Compose) deployment has no distributed tracing capability: ops-tempo produces no trace
data and an empty "Trace Analysis" page is expected. For the same reason there is no need to configure object
storage for Tempo on a single node. Tracing requires applications to report over OTLP and belongs to cluster
deployments — see Connecting Distributed Tracing.
Technical Architecture
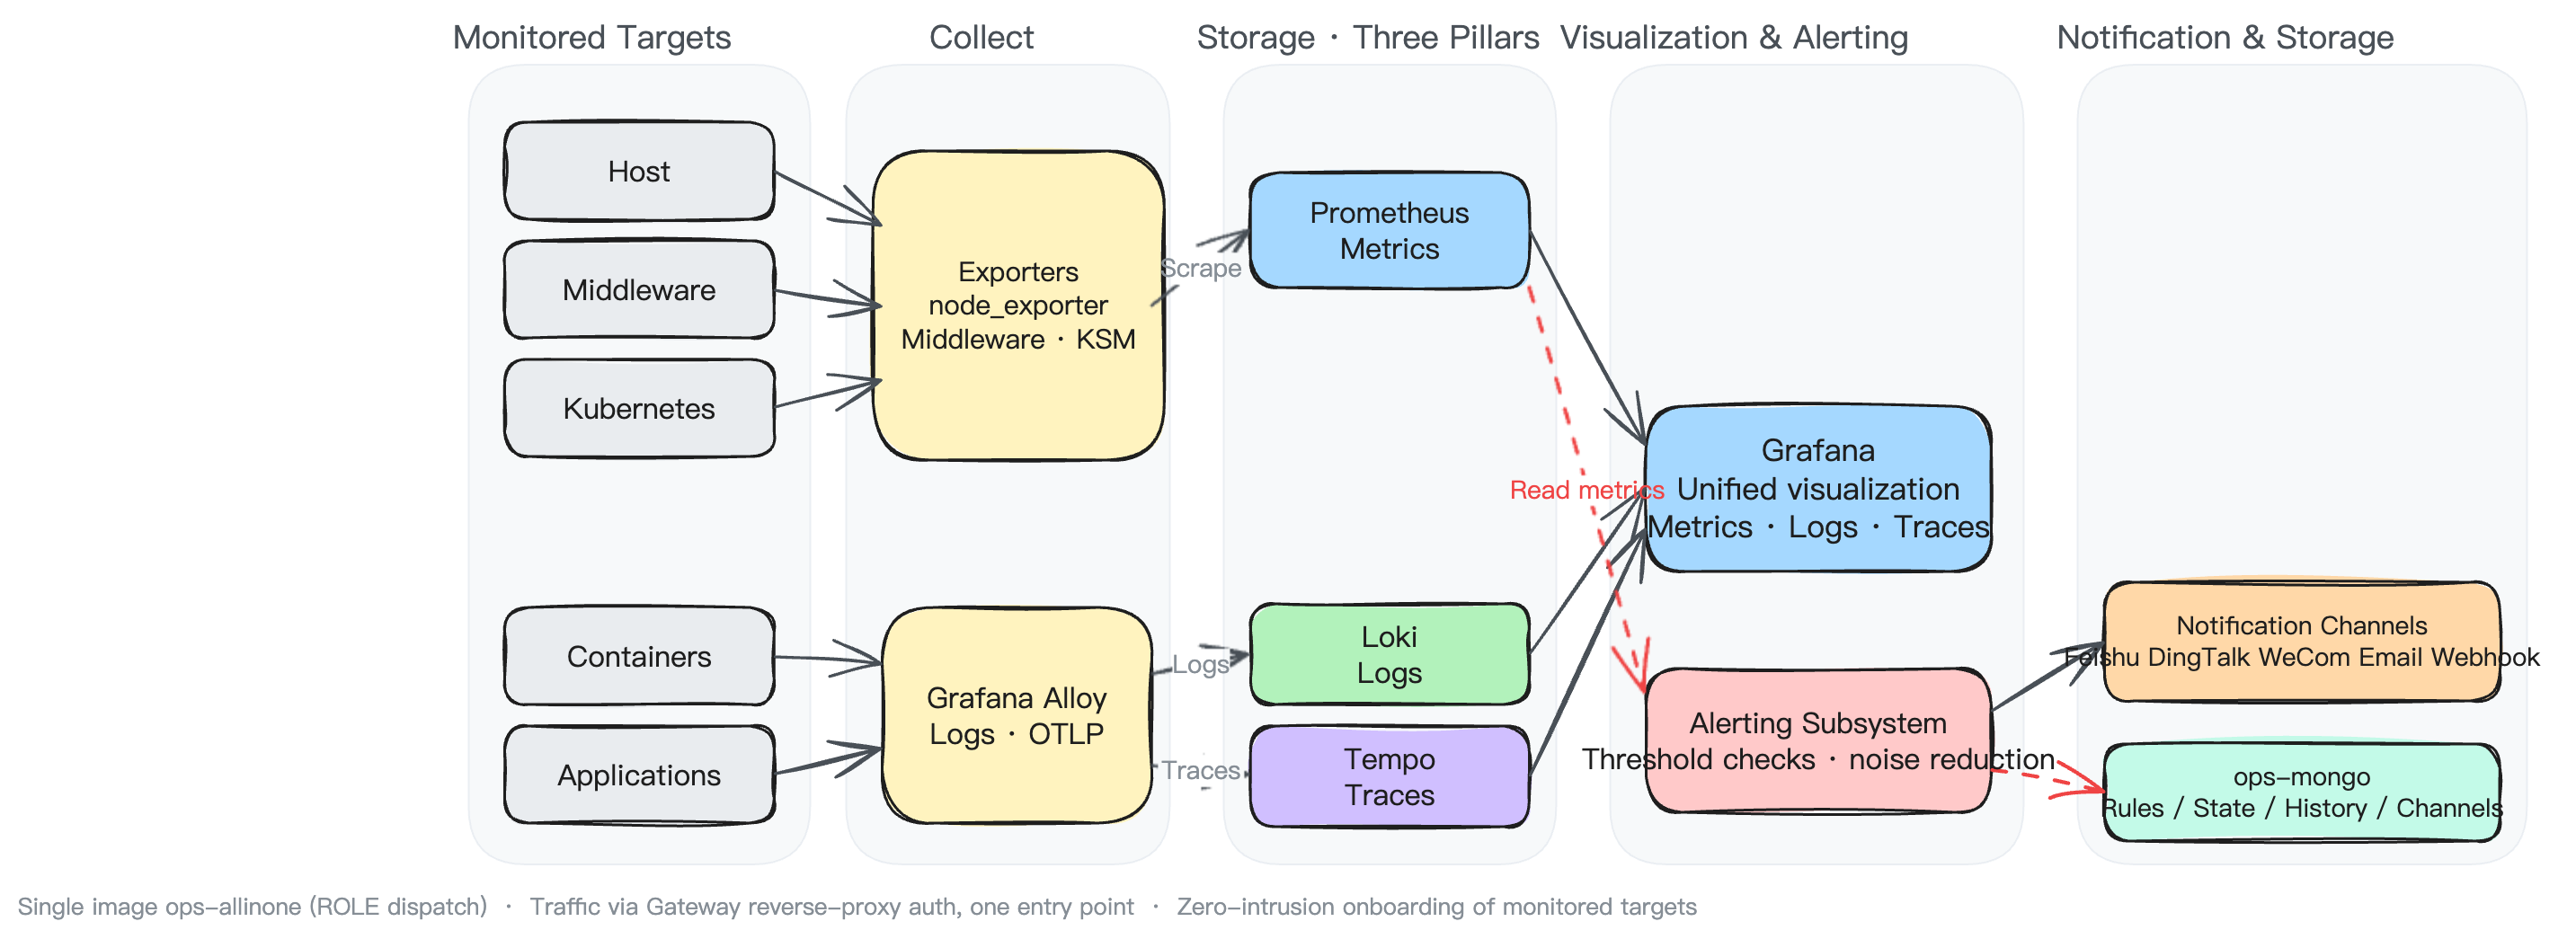
Ops Platform builds its metrics and visualization capabilities around Prometheus + Grafana, and integrates Loki (log aggregation), Tempo (distributed tracing), and Grafana Alloy (unified collection agent), bringing metrics, logs, and traces together for unified querying in Grafana:
Data flow:
- Metrics: node_exporter (hosts), the various middleware exporters, and kube-state-metrics (K8s objects) are scraped and stored by Prometheus.
- Logs: container stdout is collected by Alloy, HAP microservice logs are pushed directly via serilog, and both flow into Loki.
- Traces: applications report to Alloy via OTLP, which forwards them into Tempo.
- Display and alerting: Grafana reads the data sources above to render dashboards; the platform's self-developed alerting subsystem runs independently of Grafana, checking rules on a schedule and notifying through multiple channels.
Starting from 1.4.0, all components are merged into a single image ops-allinone, with each service distinguished by role via the ROLE environment variable. You only need to pull one image to deploy, and offline delivery is likewise just a single file.
Component Versions
| Component | Version | Role |
|---|---|---|
| Prometheus | 3.1.0 | Metrics collection and storage |
| Grafana | 12.2.1 | Unified visualization interface |
| Loki | 3.5.8 | Log aggregation and search |
| Tempo | 2.9.0 | Distributed trace storage |
| Grafana Alloy | 1.11.3 | Unified observability collection (container logs / OTLP) |
| node_exporter | 1.8.2 | Host resource metrics |
| kube-state-metrics | 2.10.1 | Kubernetes cluster object state |
| Middleware exporters | kafka 1.6.0 / elasticsearch 1.5.0 / redis 1.44.0 / mysqld 0.15.1 / mongodb 0.42.0 | Middleware performance metrics |
| MongoDB | 4.4.28 | Alerting subsystem's own storage (decoupled from monitored targets) |