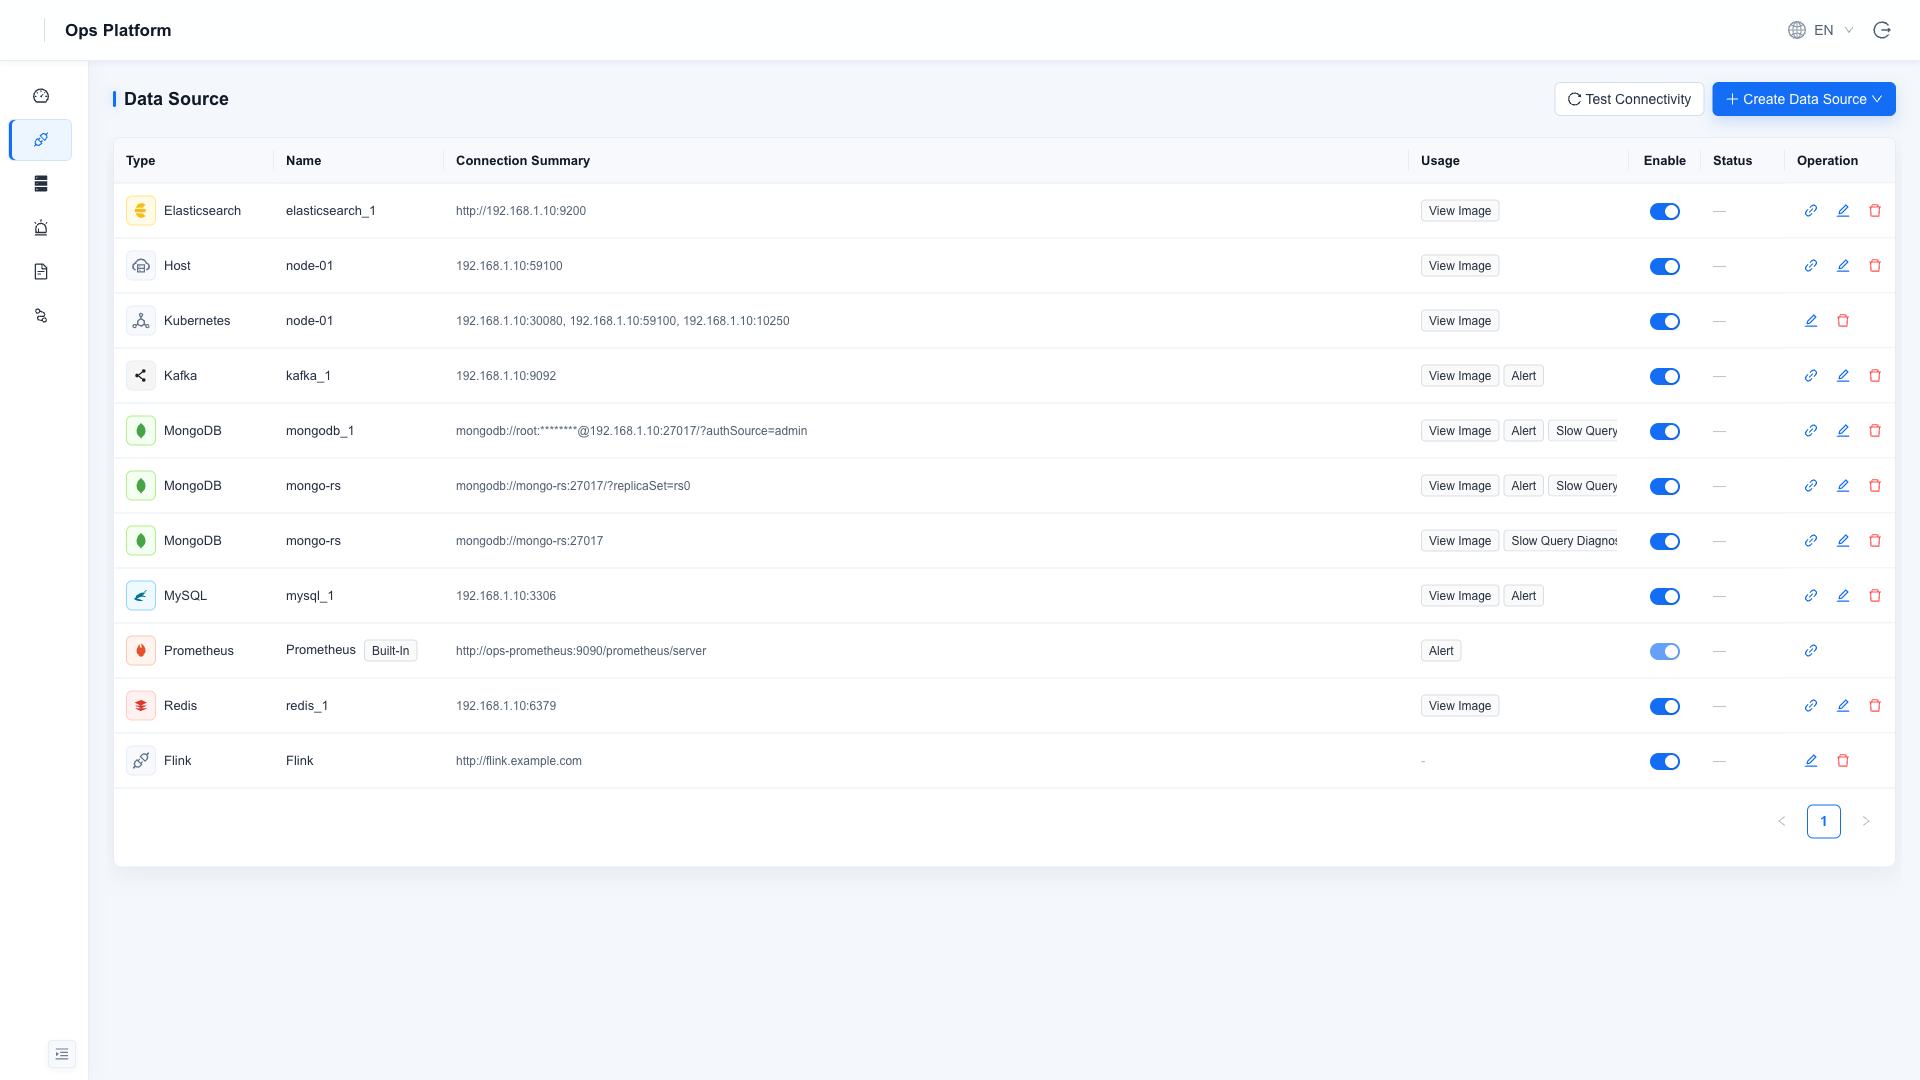
Data Source Management
Data Sources is the configuration hub of the Ops Platform—every monitored host, middleware, and cluster is registered here, and registering data sources is the first step after the platform is installed. Both the Resource Monitoring menus and the available types in Alert Rules are determined dynamically by the data sources enabled here.
Supported Types
| Type | Multiple Instances | Connection |
|---|---|---|
| Prometheus | Built-in singleton | Platform's own metrics store; read-only, cannot be disabled or deleted |
| Host | ✅ | Host address (port connectivity and similar monitoring) |
| MySQL | ✅ | Host / port / username / password |
| MongoDB | ✅ | Connection URI, replica set supported |
| Redis | ✅ | Host / port / password / DB |
| Kafka | ✅ | Broker address, SASL supported |
| Elasticsearch | ✅ | Address + HTTP Basic authentication |
| Kubernetes | ✅ | Out-of-cluster (static): see Monitoring Kubernetes Clusters |
| Flink | Singleton entry | Flink Web UI address (once enabled, a Flink entry appears on the left, accessed via the platform's reverse proxy) |
Collection Status (since 1.4.8)
Every data source in the list carries a Collection Status, telling you directly whether it is actually collecting data right now — no need to dig through container logs:
| Status | Meaning | Typical fix |
|---|---|---|
| Collecting | Normal, metrics are being written | — |
| No Data | The collector is alive but reads no metrics | Usually an account / password / privilege problem. Hover to see the raw reason |
| Stopped | The collector process is not running | Hover to see why it exited (unreachable address, wrong port, auth failure...); the process retries automatically |
| Not Collected | No collector was started for it | Check that the "metrics" purpose is selected and the source is enabled |
| Unknown | The agent has not reported yet | Confirm the ops-agent container is running |
Hover over a red status to see the raw failure reason (for example 401 unable to authenticate user or
connection refused). When a panel has no data, start here.
Where Configuration Takes Effect
This page is the single source of truth for collection: add sources, change passwords, enable or disable them here — changes take effect immediately, no container restart required.
The middleware ENV_* values in ops.yaml are seeded into this page on the first startup only and are
never read again. If the deployment explicitly sets ENV_PROMETHEUS_SD_MODE=env, the opposite applies:
collection reads only ops.yaml and this page does not participate in collection (a clear banner appears at
the top of the page in that case; the sources here are still used for alerting and slow-query diagnosis).
Purposes
Each data source has one or more purposes selected, which determine where it appears across features:
| Purpose | Effect |
|---|---|
| Dashboards | Displays this instance's dashboard under the corresponding Resource Monitoring menu |
| Alerting | Allows creating rules for this instance under Alert Rules |
| Slow Query Diagnosis | MongoDB only: enables slow query analysis and index diagnosis. Read-only observation — the platform does not write business data or create indexes on its own; diagnostic history is stored in the platform's own ops-mongo |
Account Permissions for Monitored Targets
Before registering, prepare an account with the appropriate permissions for each target (the platform observes read-only):
| Target | Required Permissions |
|---|---|
| MySQL | SELECT, SHOW DATABASES, PROCESS, REPLICATION CLIENT |
| MongoDB | root recommended; see the minimal-privilege example below |
| Redis | Data read permission |
| Kafka | If authentication is enabled, permission to read cluster metadata |
| Elasticsearch | Index read/write permission |
| Flink | Web address must allow access from the Ops Platform's internal network |
MongoDB minimal privileges (readWrite / dbAdmin are used for index creation in slow query diagnosis):
use admin
db.createUser({
  user: "opsuser", pwd: "your_secure_password",
  roles: [
    { role: "clusterMonitor", db: "admin" },
    { role: "readAnyDatabase", db: "admin" },
    { role: "clusterManager", db: "admin" },
    { role: "dbAdmin", db: "mdwsrows" },     { role: "readWrite", db: "mdwsrows" },
    { role: "dbAdmin", db: "mdservicedata" }, { role: "readWrite", db: "mdservicedata" },
    { role: "dbAdmin", db: "mdworksheet" },   { role: "readWrite", db: "mdworksheet" },
    { role: "dbAdmin", db: "mdworkflow" },    { role: "readWrite", db: "mdworkflow" }
  ]
})
Filling in Elasticsearch credentials
The most common failure for this type is the connection test passes but the collection status shows "No Data" — almost always a wrong username.
| Field | Value |
|---|---|
| URL | http://<es-host>:9200, protocol prefix included |
| Username | md — the Elasticsearch shipped with the HAP private deployment uses md, not elastic |
| Password | the Elasticsearch password set during HAP deployment |
When seeding through the environment variable (ENV_ELASTICSEARCH_PASSWORD), the value is the whole
username:password pair, for example md:your_password — not the password alone.
To confirm data is really flowing, check the Collection Status column on this page: it should read Collecting. When it reads "No Data", hover it for the reason; wrong credentials are reported explicitly.
Operations
- Create: click New Data Source at the top right → choose a type → fill in the connection details.
- Test connection: performs a real authentication check with actual credentials (MongoDB ping, MySQL login, Kafka metadata fetch, Redis AUTH, ES authentication request)—not just a port probe.
- Enable / disable: toggle the switch in the list. Once disabled, the corresponding Resource Monitoring menu and alert types are automatically hidden, and existing alert rules stop being scheduled.
- Edit: existing saved passwords are shown masked; leave blank to keep them unchanged.
Passwords and connection URIs are AES-encrypted with ENV_ALERT_CRYPTO_KEY before being stored, and interfaces always return masked values. Be sure to set and safeguard this key on first deployment—changing the key will make already-stored credentials undecryptable and require re-entering them.