Slow Query Optimization
What is a slow query
A slow query refers to a query that takes a long time to execute.
Usually, database queries are completed quickly, but when the data volume in a table is very large (e.g. tens of thousands of rows or more), frequent querying from these tables can increase the burden on the database. This may lead to excessive use of hardware resources, such as high CPU usage, excessive memory usage, and high system load. Therefore, query operations become slow, taking several hundred milliseconds or even seconds to complete.
To optimize queries, we can take some measures, such as:
- Index optimization: Create appropriate indexes to speed up queries.
- Query optimization: Write efficient query methods to avoid unnecessary computations and data transfers.
- Hardware optimization: Increase the hardware resources of servers to handle larger data sets.
- Multi-cluster data storage: Application data multi-cluster storage and Row records multi-cluster storage. Increase vertical scalability to alleviate the continuous pressure on a single database from growing business.
Index Optimization
Visit the HAP Help Center to learn about basics of indexes and index creation and management.
Query Optimization
When dealing with worksheets containing hundreds of thousands of rows or more, it is important to pay attention to the way queries are executed and to create indexes for the fields involved in the query conditions in advance.
Usually, the best practice is to use precise queries, such as using the "equal to" condition. Especially when the field values are non-repetitive and already indexed, this query method is extremely efficient.
Additionally, there are some query methods that do not involve indexes:
-
Negative conditions such as "not equal to," "not contains," "not starting with" in the filter
-
Conditions such as "contains," "is empty" in the filter
-
Adding "or" condition in the filter
-
The search on the top right of the worksheet is regular query and does not use the index
-
Selection fields where a single option value has a high percentage, searches will not use the index
-
When text fields are sorted by Pinyin, sorting indexes will not be effective
For worksheets with a large amount of data, it is advisable to minimize the use of the above-mentioned large batch query conditions to reduce database load.
Hardware Optimization
-
Increase CPU Cores:
- MongoDB is a multi-threaded application, so increasing the CPU cores can improve concurrency.
- Choose high-performance multi-core CPUs for better query and write handling.
-
Increase Memory:
- Memory is crucial for MongoDB performance. Increasing memory can improve cache efficiency and reduce disk I/O.
- MongoDB uses memory as a working set cache, so having enough memory can reduce disk reads and improve query performance.
-
Use High-Performance SSD Disk:
- SSD disks are faster than traditional mechanical hard drives (HDD), with lower access latency and higher throughput.
- MongoDB's default storage engine is WiredTiger, which has good support for SSD disks.
Practical Tips for Index Optimization
Searching Logs
If the MongoDB process is consuming high CPU, it is usually due to a large number of slow query statements. You can optimize further by checking the MongoDB logs to identify these slow queries.
- HAP Standalone Mode
- HAP Cluster Mode
The default path for MongoDB logs is /data/mingdao/script/volume/data/logs/mongodb.log.

If a custom data path is sett, please search for the mongodb.log file in the actual data path.
Please search for the mongodb.log file on the server where MongoDB is deployed.

If it is deployed by the official team, it is typically located at /data/logs/mongodb/mongodb.log.
Log Analysis Examples
Here are two examples for log analysis.
Example 1
2023-03-08T15:50:43.075+0800 I COMMAND [conn38294] command mdwsrows.ws63083dafdf551460042a73 command: find { find: "ws63083dafdf551460042a73", filter: { 63e0bafdafa62a19751ee00: "4115fd005", status: 1.0 }, sort: { utime: -1 }, projection: { _id: 0, status: 0, sharerange: 0, wsutime: 0, keywords: 0, discussunreads: 0, users: 0, owners: 0, unreads: 0 }, limit: 1 } planSummary: COLLSCAN keysExamined:0 docsExamined:381665 hasSortStage:1 cursorExhausted:1 numYields:2981 nreturned:1 reslen:1456 locks:{ Global: { acquireCount: { r: 5964 } }, Database: { acquireCount: { r: 2982 } }, Collection: { acquireCount: { r: 2982 } } } protocol:op_query 1023ms
Meaning of Fields:
- mdwsrows: database
- ws63083dafdf551460042a73: sheet name
- command: details of the operation command
- find: query criteria
- 63e0bafdafa62a19751ee00: field (control ID)
- COLLSCAN: full sheet scan
- docsExamined:381665: total records in the sheet
- op_query 1023ms: duration
Log Interpretation: The log indicates a query on the ws63083dafdf551460042a73 worksheet for the field 63e0bafdafa62a19751ee00 with a value of 4115fd005, resulting in a total duration of 1023 milliseconds due to a full sheet scan.
Suggested Indexing: Consider adding an index to the field 63e0bafdafa62a19751ee00.
Example 2
2023-04-25T08:12:10.736+0000 I COMMAND [conn1696545] command mdwsrows.ws629f242342bb5f060f3da4 command: aggregate { aggregate: "ws629f242342bb5f060f3da4", pipeline: [ { $match: { 62c9c6076c186b941274189f: "90123c1d-1498-43a4-b96b-001a69fd4bb9", 62ccea346123b943f747acf: { $in: [ "0cda5ce1-32139-4c52-b2f4-b324545ccfd1", "2e0e92ec-a935-43fa-a4a3-5fbdee85c0c0" ] }, $and: [ { 62c9c6076c186b941274189f: "90123c1d-1498-43a4-b96b-001a69fd4bb9" }, { 62ccea346123b943f747acf: { $in: [ "0cda5ce1-32139-4c52-b2f4-b324545ccfd1", "2e0e92ec-a935-43fa-a4a3-5fbdee85c0c0" ] } } ], status: 1.0 } }, { $group: { _id: "null", count: { $sum: 1 } } } ], cursor: {}, $db: "mdwsrows", lsid: { id: UUID("d09a5780-0115-4182-8eb2-9de7d76fd834") }, $clusterTime: { clusterTime: Timestamp(1682410329, 2213), signature: { hash: BinData(0, 6B87048FC23C103EE23E4E026B9B246CD45F), keyId: 720303239516495874 } } } planSummary: COLLSCAN keysExamined:0 docsExamined:468021 cursorExhausted:1 numYields:3656 nreturned:1 queryHash:97671D20 planCacheKey:97671D20 reslen:282 locks:{ ReplicationStateTransition: { acquireCount: { w: 3658 } }, Global: { acquireCount: { r: 3658 } }, Database: { acquireCount: { r: 3658 } }, Collection: { acquireCount: { r: 3658 } }, Mutex: { acquireCount: { r: 2 } } } storage:{ data: { bytesRead: 12110018, timeReadingMicros: 11575 } } protocol:op_msg 1043ms
Meaning of Fields:
- mdwsrows: database
- ws629f242342bb5f060f3da4: sheet name
- command: details of the operation command
- aggregate: aggregation operation
- $match: filter
- 62c9c6076c186b941274189f: field (control ID)
- 62ccea346123b943f747acf: field (control ID)
- $in: include
- COLLSCAN: full sheet scan
- docsExamined:468021: total records in the sheet
- op_msg 1043ms: duration
Log Interpretation: In the ws629f242342bb5f060f3da4 sheet in the mdwsrows database, take aggregation operation to query data that meet the following conditions: the value of the 62c9c6076c186b941274189f field is "90123c1d-1498-43a4-b96b-001a69fd4bb9", and the value of the 62ccea346123b943f747acf field contains "0cda5ce1-32139-4c52-b2f4-b324545ccfd1" and "2e0e92ec-a935-43fa-a4a3-5fbdee85c0c0". Full sheet scan, and total time spent is 1043 milliseconds.
Suggested Indexing: Consider adding a composite index for the 62c9c6076c186b941274189f and 62ccea346123b943f747acf fields.
Correspondence of Field IDs in Logs to Fields in Worksheet
After obtaining the worksheet ID, you can access the worksheet page by visiting systemURL/worksheet/worksheetID.
For example, if the sheet name is known in the log as ws643e4f73c70d5c2cc7285ce3, remove the ws at the beginning and 643e4f73c70d5c2cc7285ce3 is the worksheet ID.
By visiting systemURL/worksheet/643e4f73c70d5c2cc7285ce3, you can access the corresponding worksheet.
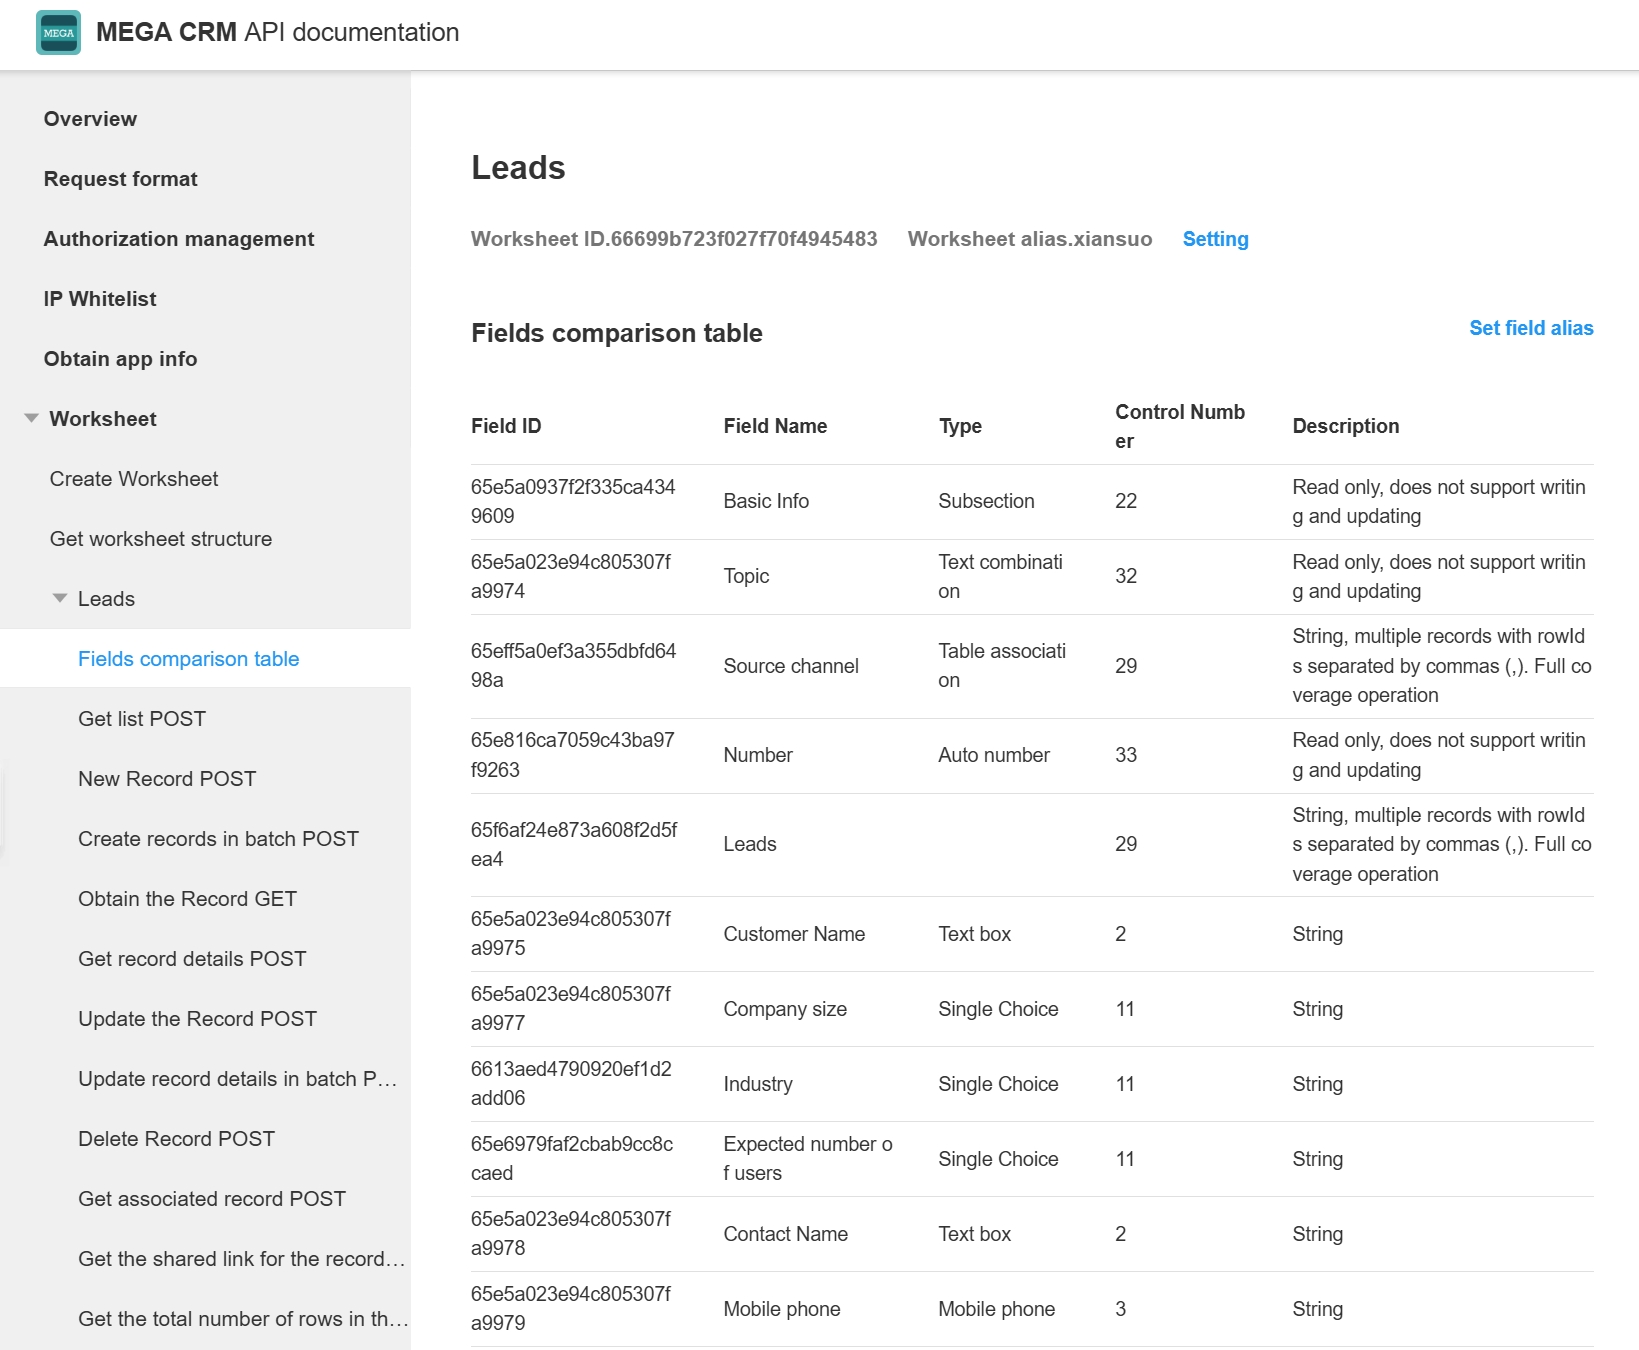
Once in the worksheet, the App Admin can see the API documentation as shown below.
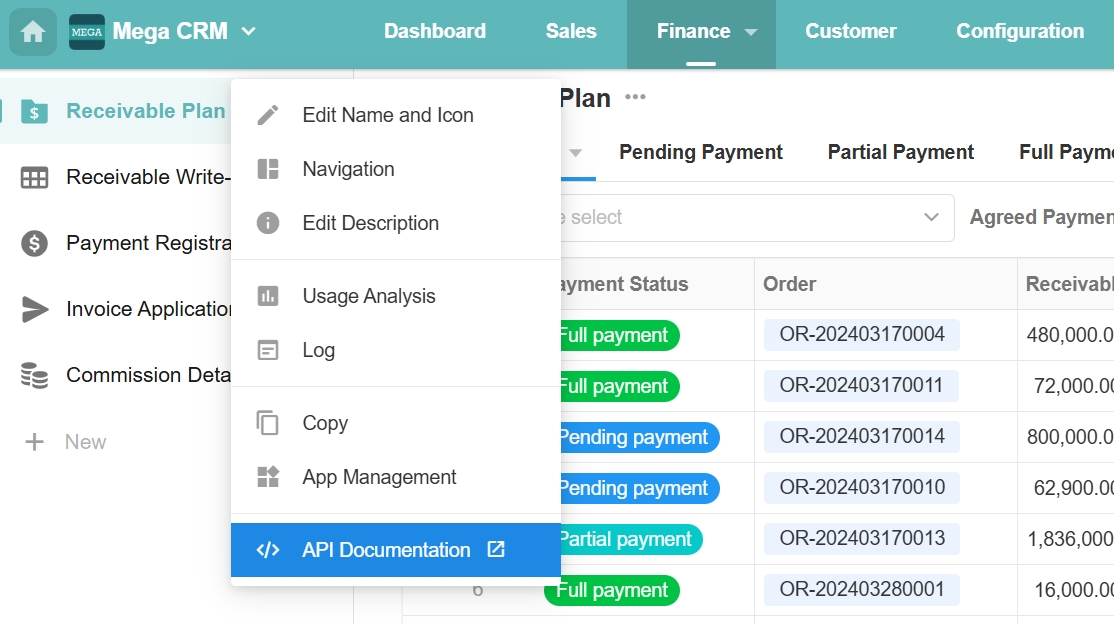
The API documentation includes a field table where you can see the correspondence between field IDs and field names.
Add Indexes
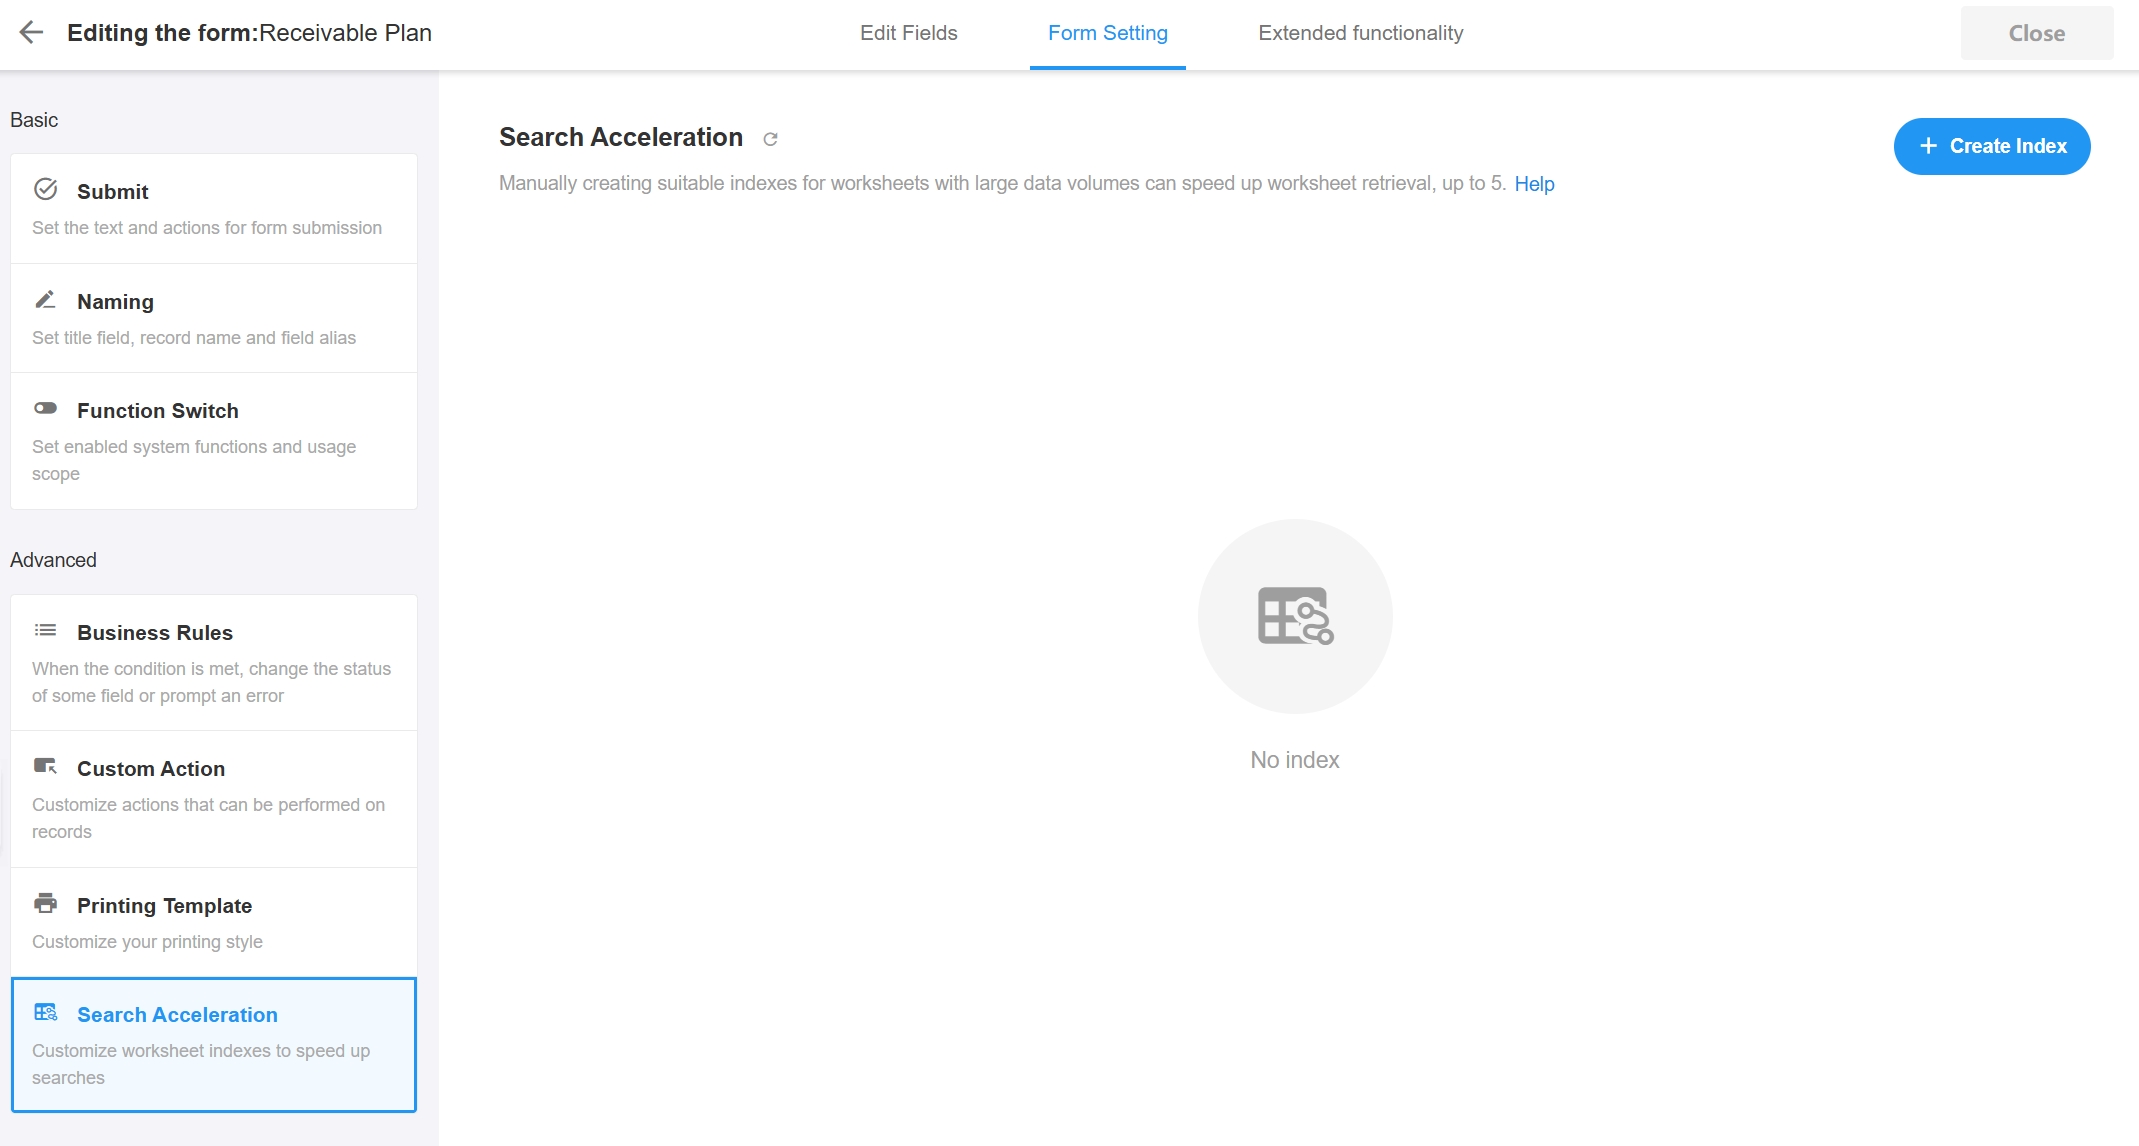
Way 1: Add in the worksheet settings page
After finding the field corresponding to the field ID in the API documentation, go to the worksheet settings page and add an index to the field.
Way 2: Add in the database
Add an index to the fields mentioned in the examples above, log in to the MongoDB database and execute the following command.
use mdwsrows

db.ws63083dafdf551460042a73.createIndex({"63e0bafdafa62a19751ee00":1},{background: true})

db.ws629f242342bb5f060f3da4.createIndex({"62c9c6076c186b941274189f":1,"62ccea346123b943f747acf":1},{background: true})